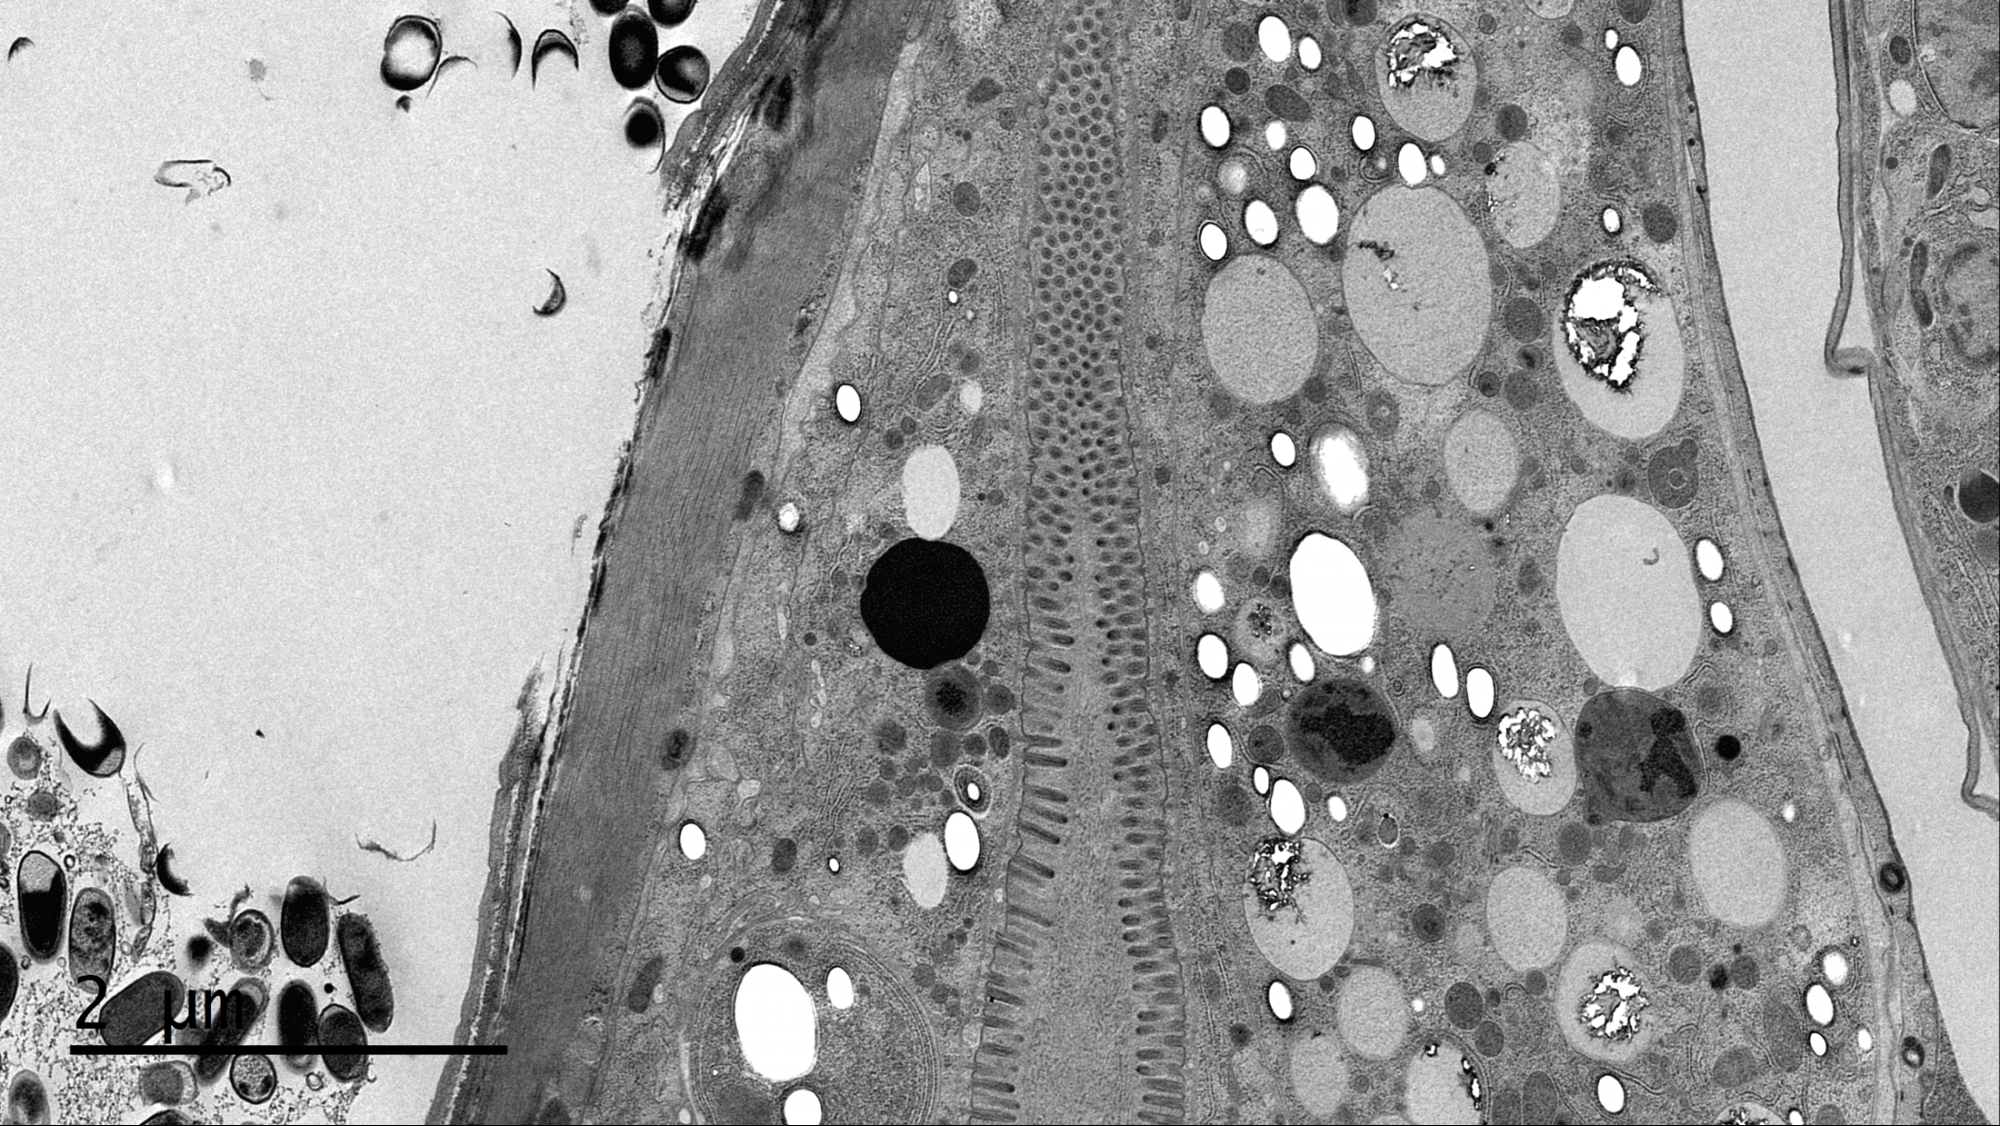
High resolution image of C. elegans
OneView camera captures high resolution images of biological specimens, such as C.elegans at 3840 x 2160 pixels.
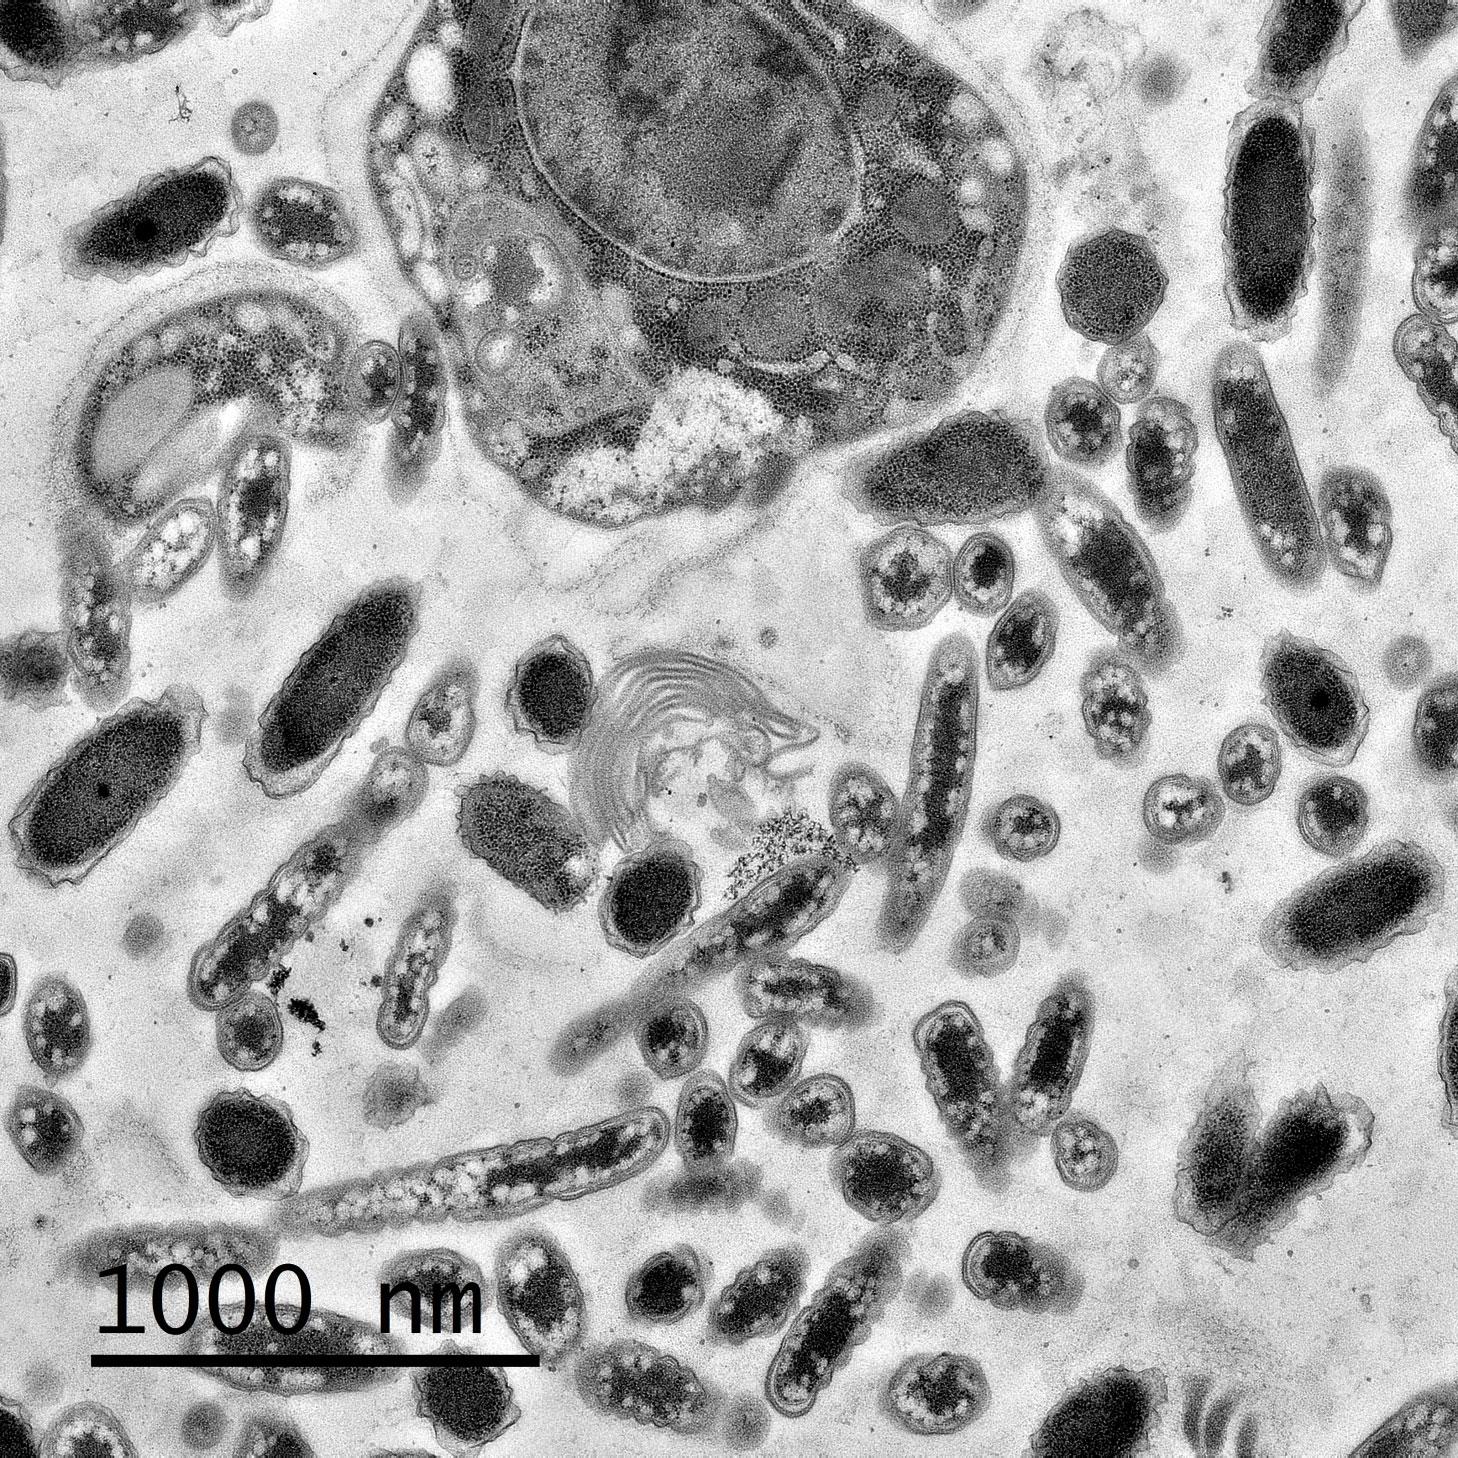
High resolution image of cow intestine
OneView camera captures 4k x 4k resolution images of biological specimens, such as cow intestine.
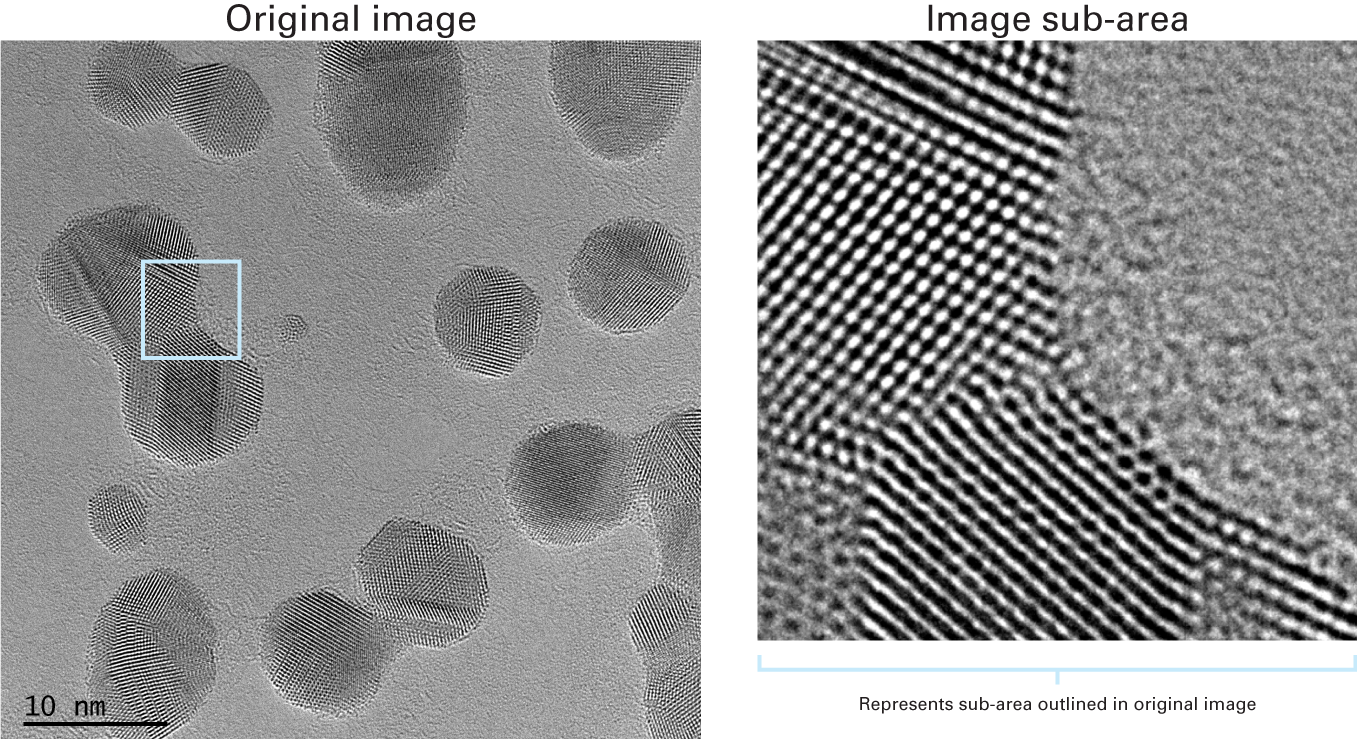
High resolution lattice imaging of Au nanoparticles
Image courtesy JEOL Japan and Gatan, Inc., US
Because of OneView camera’s high resolution and high sensitivity, lattice imaging with a large field of view is effortless.
Sample: gold (Au) nanoparticles; beam energy: 300 kV; image size: 4k x 4k; exposure: 1 s; number of frames: 25
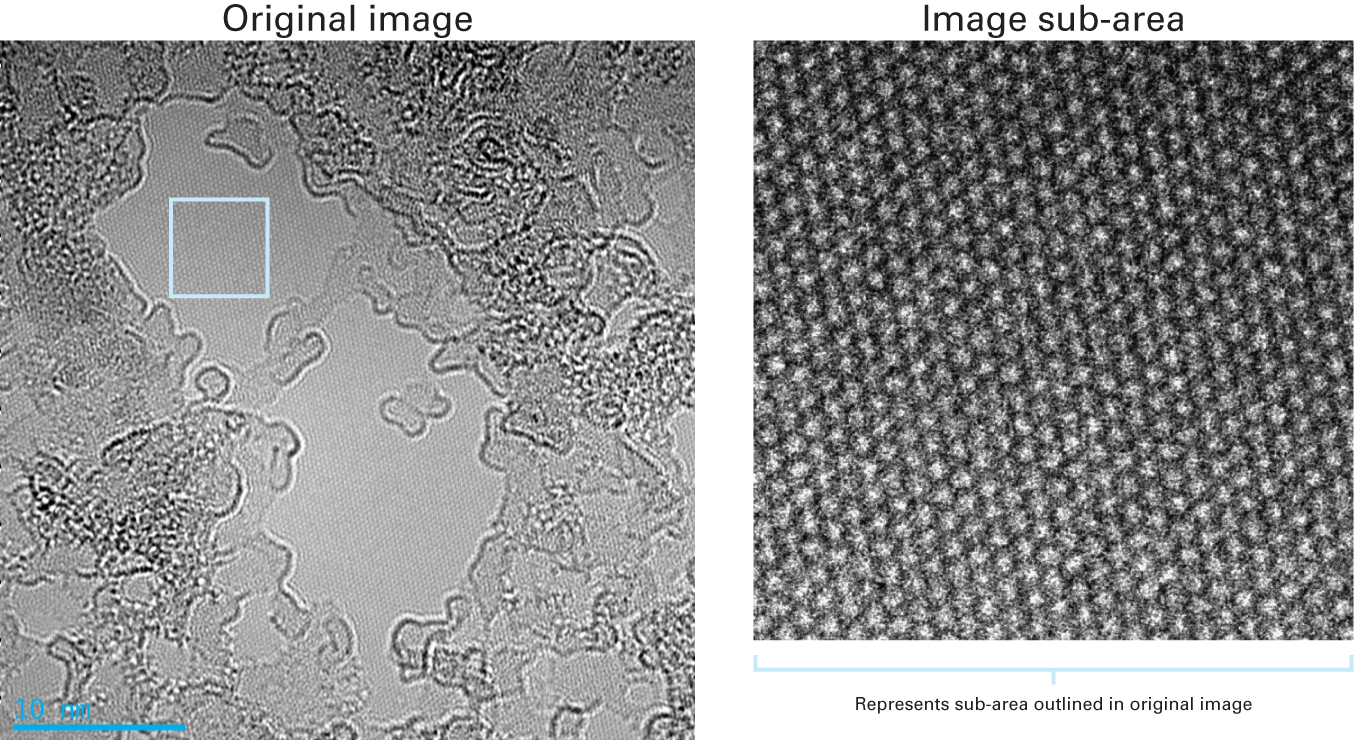
HRTEM images of graphene
Image courtesy JEOL Japan and Gatan, Inc., US
High sensitivity and drift correction of the OneView camera makes it easier to capture these HRTEM images of graphene.
Sample: graphene; beam energy: 80 kV; image size: 4k x 4k; exposure: 4 s; number of frames: 100
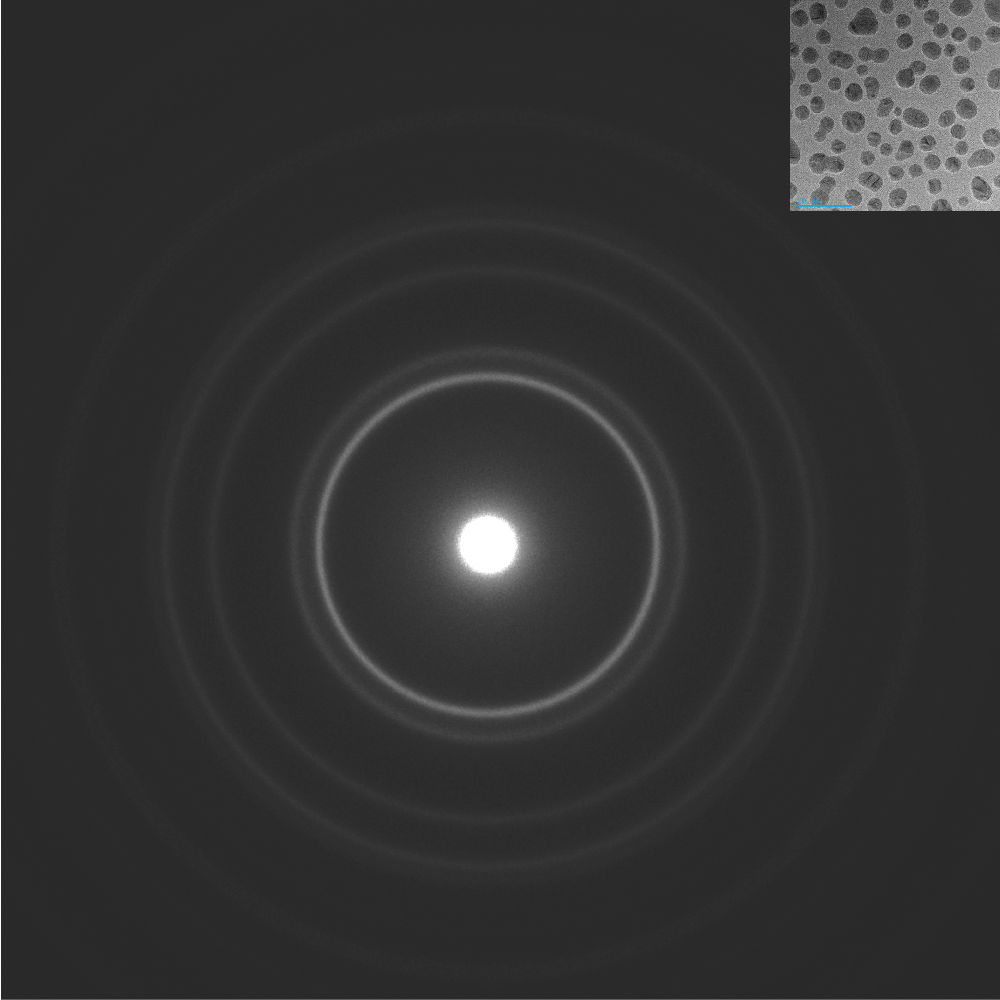
Diffraction without artifacts for gold on carbon sample
The extreme sensitivity of the OneView camera does not affect its ability to collect diffraction patterns without imaging artifacts, even with an unobstructed central beam. The camera’s CMOS design and high readout speed ensures no streaking or blooming.
Sample: gold (Au) on carbon (C); beam energy: 200 kV; image size: 4k x 4k; exposure: 1 s; number of frames: 25; spot size: 7; camera length: 1 m; insert shows the area where the diffraction pattern was collected from
Diffraction without artifacts for silicon sample
The extreme sensitivity of the OneView camera does not affect its ability to collect diffraction patterns without imaging artifacts, even with an unobstructed central beam. The camera’s CMOS design and high readout speed ensures no streaking or blooming.
Sample: silicon (Si); beam energy: 200 kV; image size: 4k x 4k; exposure: 1 s; number of frames: 25
OneView camera
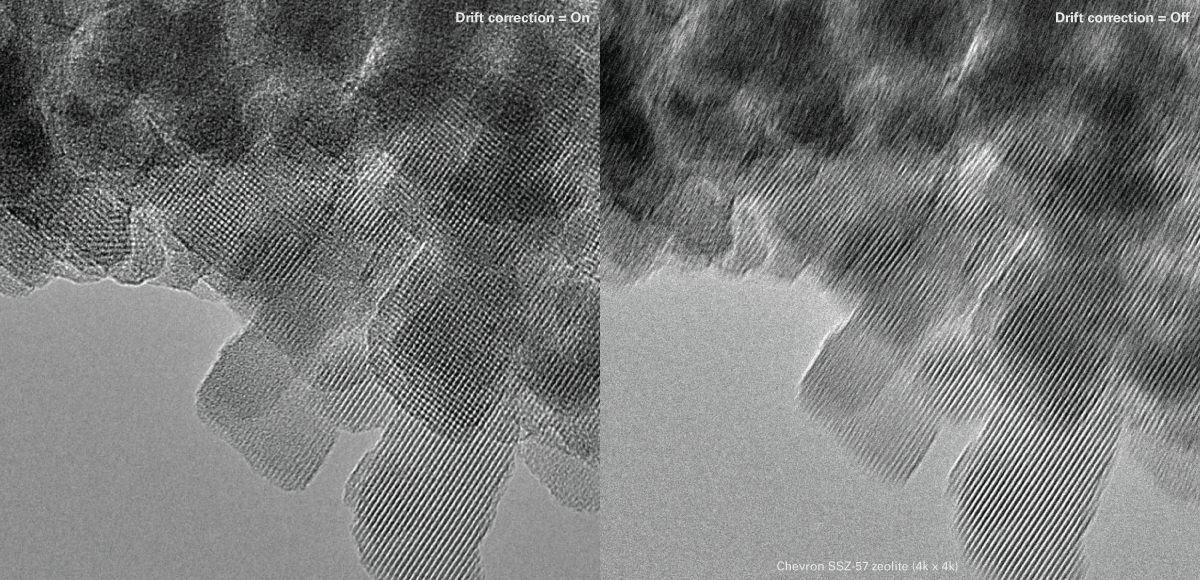
Chevron SSZ-57 zeolite (4k x 4k)
Some samples, like this zeolite catalyst, are so beam sensitive that they are distorted and destroyed quickly under the electron beam. This makes it nearly impossible capture a good image. These images acquired using the OneView camera demonstrate how the fast image acquisition rate combined with live drift correction, delivers a sharp, high-resolution image.
Sample: zeolites; image size: 4k x 4k; exposure: 1 s; number of frames: 25
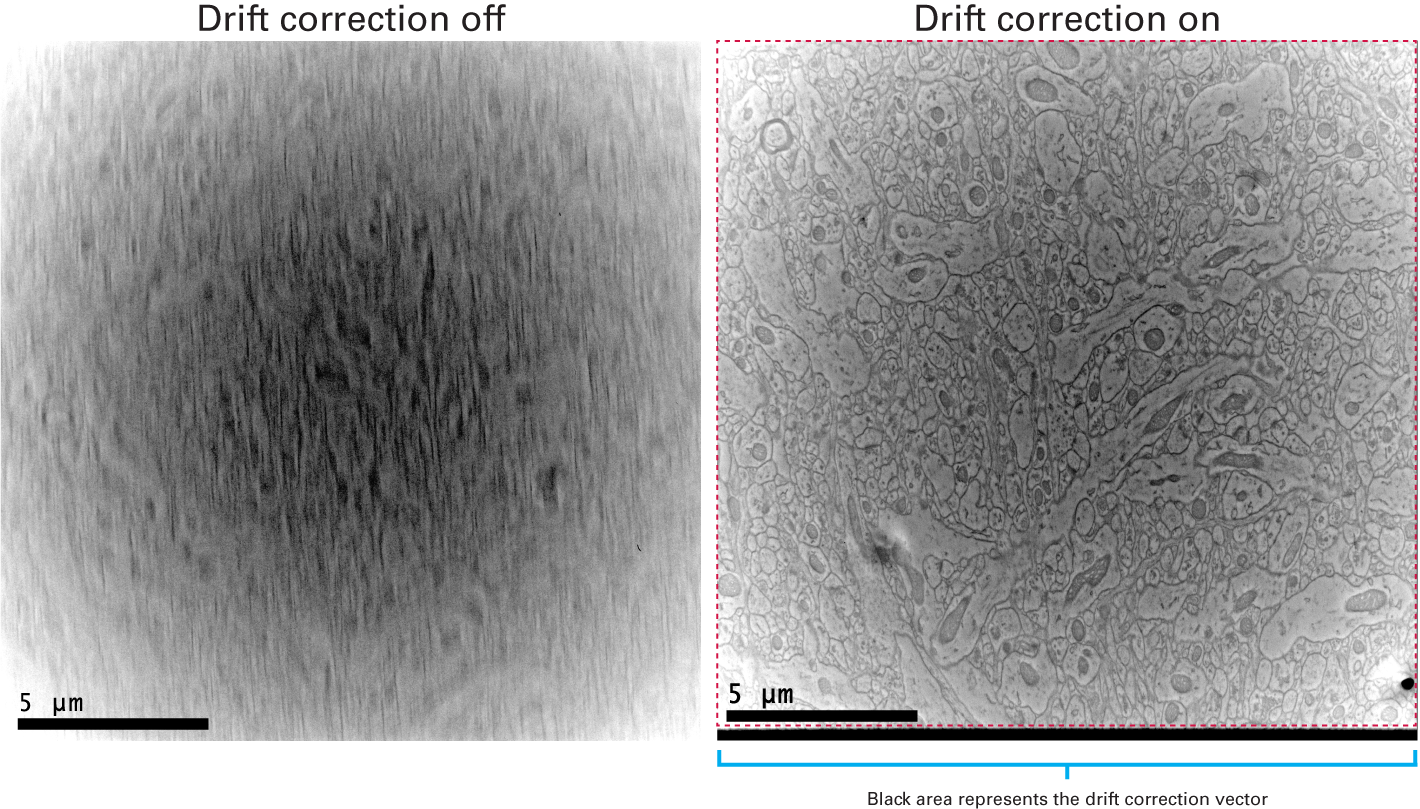
Drift correction compensates for brain sample motion
Sample was shrinking as it was exposed to the electron beam, these images were taken by the OneView camera before the objective aperture was inserted and specimen was stabilized.
Sample: brain; beam energy: 120 kV; image size: 4k x 4k; exposure: 1 s; number of frames: 25; drift correction: no (left) and yes (right)
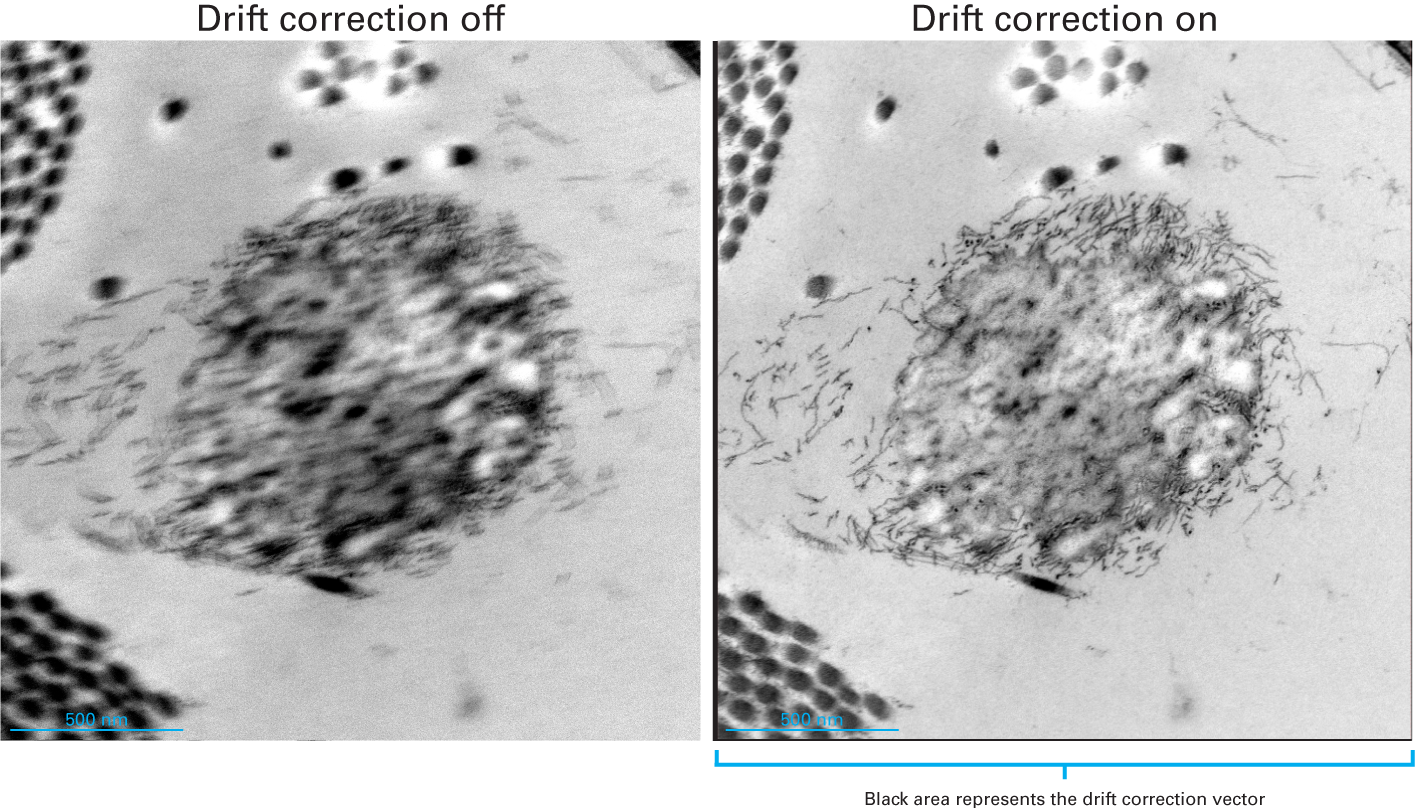
Drift correction compensates for skin cell sample motion
Images were captured from a skin specimen using the OneView camera, with drift correction on and off. Collecting high quality images of these specimens with out drift correction is very challenging as samples change and move under the electron beam.
Sample: skin; beam energy: 120 kV; image size: 4k x 4k; exposure: 1 s; number of frames: 25; drift correction: no (left) and yes (right)
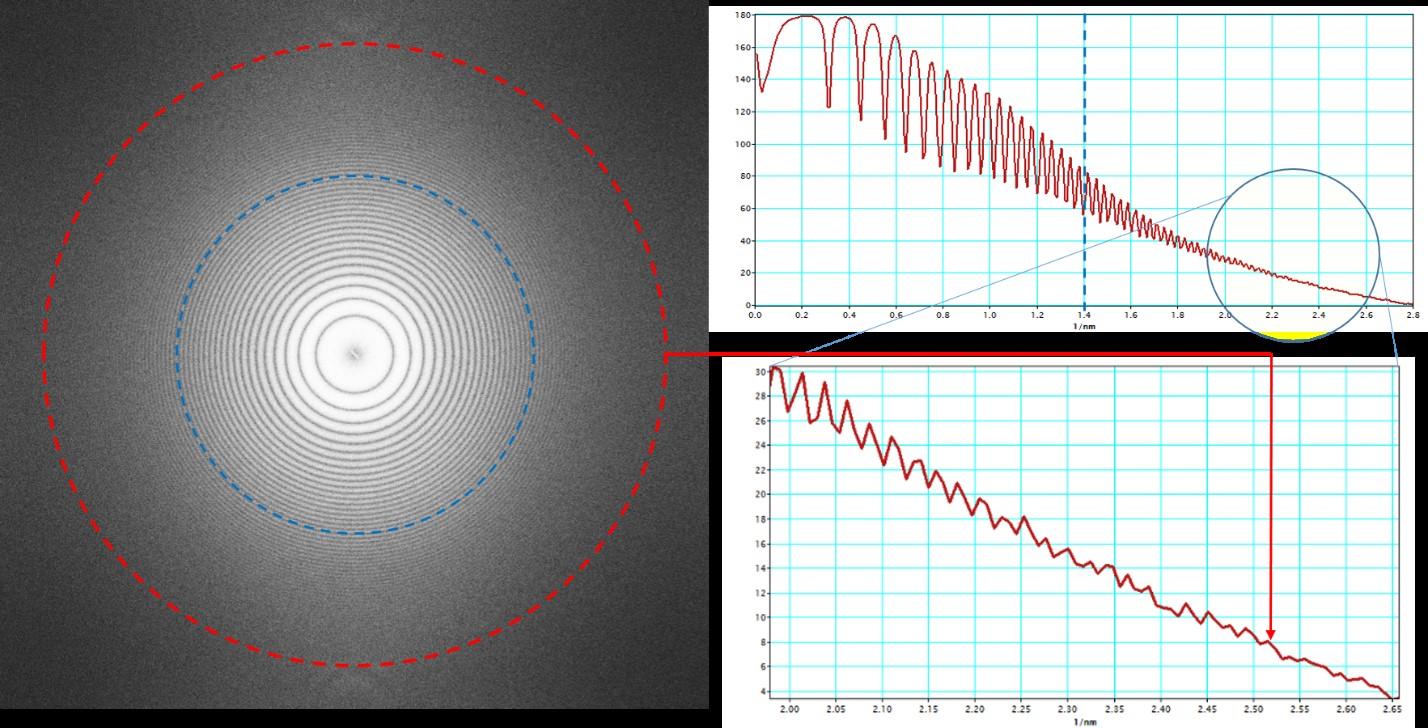
Super-resolution on GIF Quantum® LS imaging filter
Thon rings tests performed using GIF Quantum LS imaging filter (K2 camera mounted at the end of GIF Quantum® filter on a Krios microscope) shows signal at near super-Nyquist frequency under low-dose conditions typical of cryo-electron tomography. Left panel is Fourier transform of amorphous test sample (PtIr). Dashed blue circle indicates physical Nyquist, dashed red circle indicates 0.90 super-resolution Nyquist. Upper right panel is the rotationally averaged intensity. Blue dashed line indicates physical Nyquist.
Pages
