Cathodoluminescence and EELS analysis of plasmonic nanoparticles
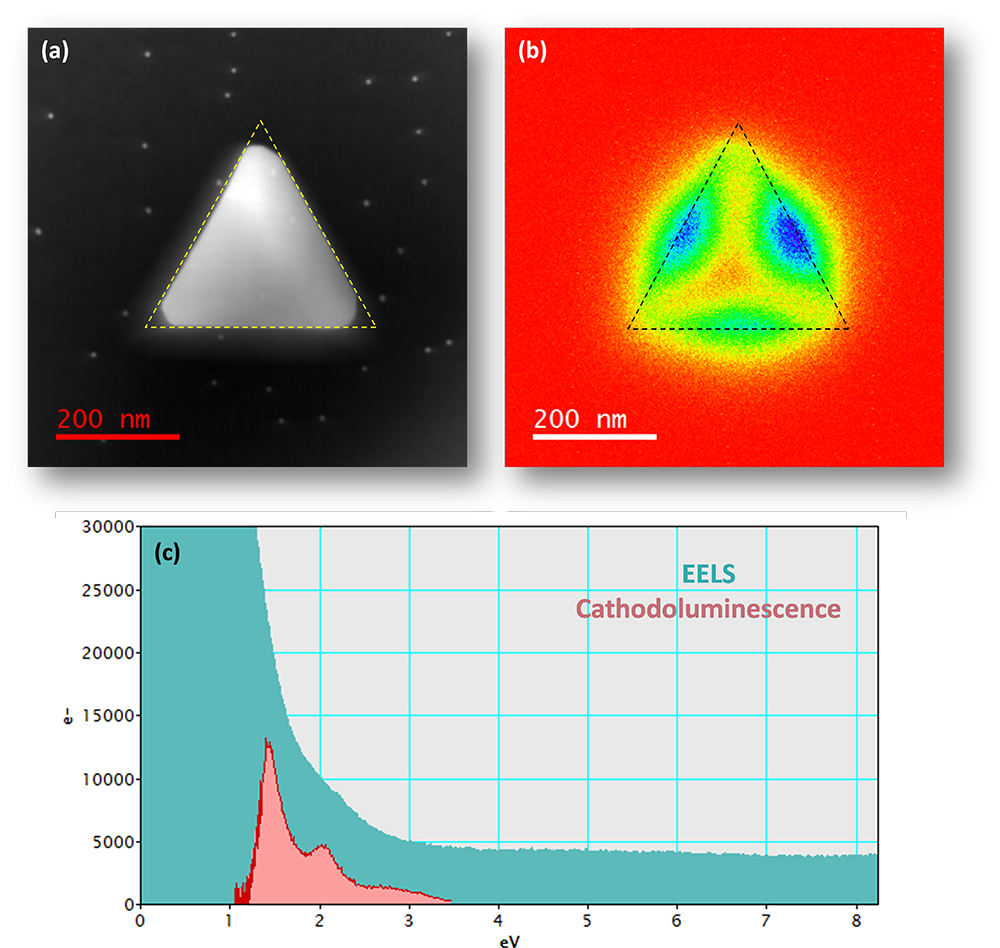
Cathodoluminescence (CL) and EELS analysis of gold prism of 250 nm side length. (a) STEM dark field image, (b) Cathodoluminescence total light intensity map with prism outlined by black dotted line and (c) Comparison of CL and electron energy loss (EELS) spectra in TEM/STEM system with FEG electron source. The tail of the EELS zero loss peak (FWHM 0.65 eV) is convoluted with the surface plasmon resonance mode obscuring information. CL is an emission spectroscopy and, therefore, independent of energy spread of primary electron beam.
Cathodoluminescence analysis of plasmonic nanoparticles
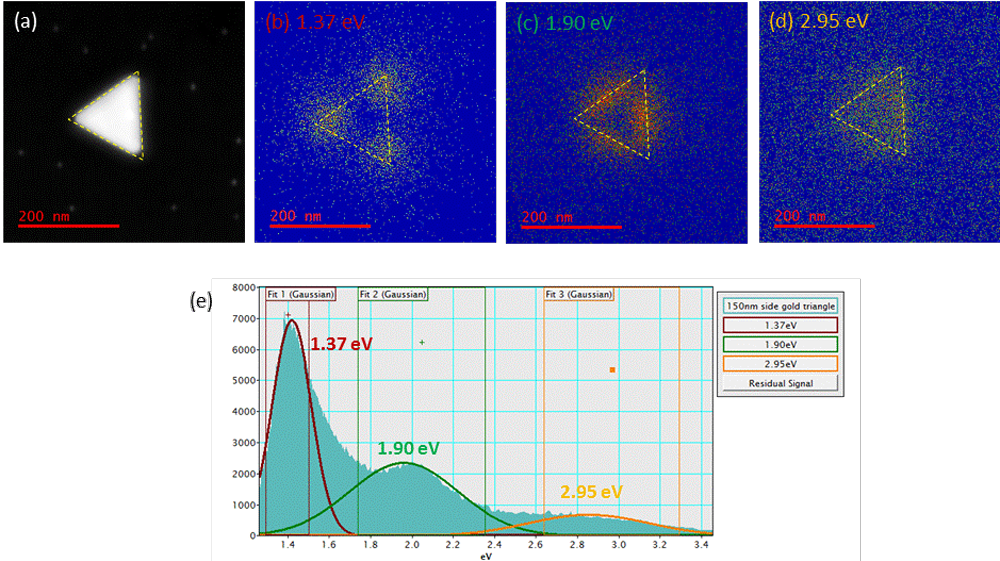
Cathodoluminescence analysis of a gold prism of side length 200 nm. (a) STEM dark field image, (b) – (d) monochromatic (spectrally resolved) cathodoluminescence images at 1.37, 1.90, and 1.95 eV (900, 650, and 420 nm, respectively) with prism outlined by yellow dotted line, (e) Overall cathodoluminescence spectrum displaying three peaks.
Methods
JEOL 2100F
STEM mode operating
100 kV
room temperature.
(a) – (d) 768 x 768 pixel images acquired in 70 s
Cathodoluminescence analysis on GaN/AlN nanowires
Data courtesy of Dr. R. Williams, Ohio State University.
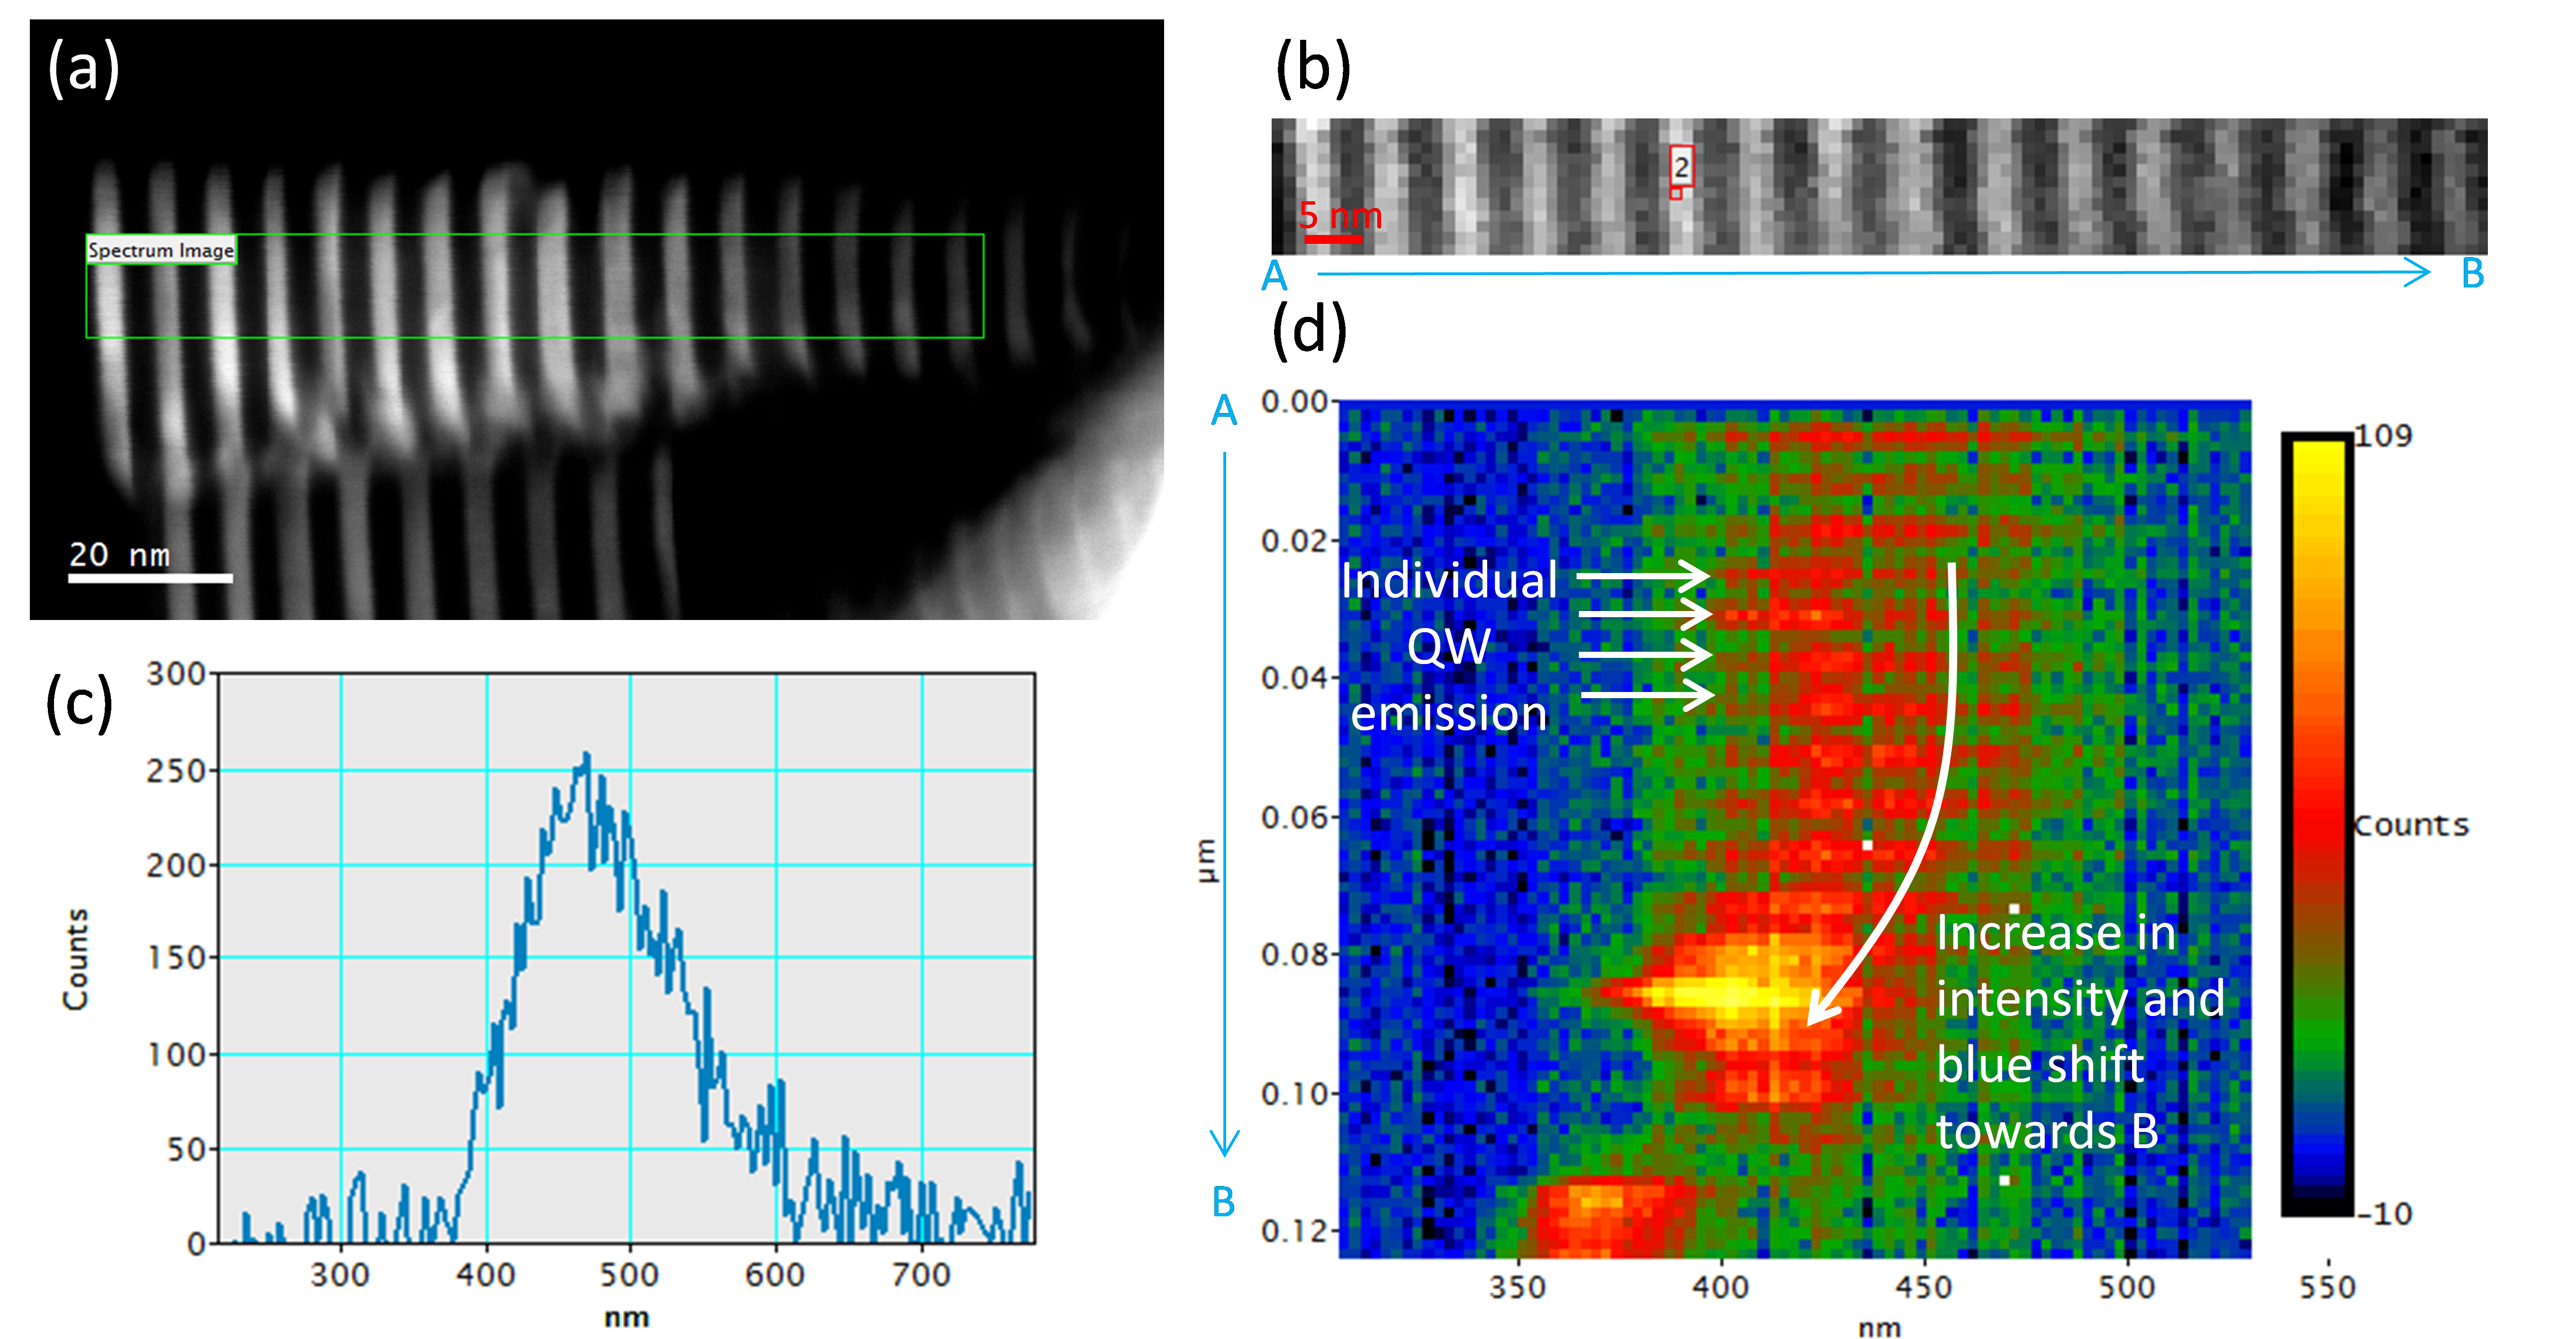
a) Dark field STEM image of GaN/AlN heterostructure nanowire with nominally 3 nm thick GaN quantum wells and 4 nm thick AlN barrier layers; GaN is bright in DF image; (b) Cathodoluminescence (CL) spectrum-image acquired from region indicated by green rectangle in (a) with intensity at 491 ±10 nm displayed; (c) Single CL spectrum extracted from the spectrum-image at point 2 as displayed in (b); (d) Projection of the CL spectrum with information along y-axis (radial axis of the nanowire) summed into a single value.
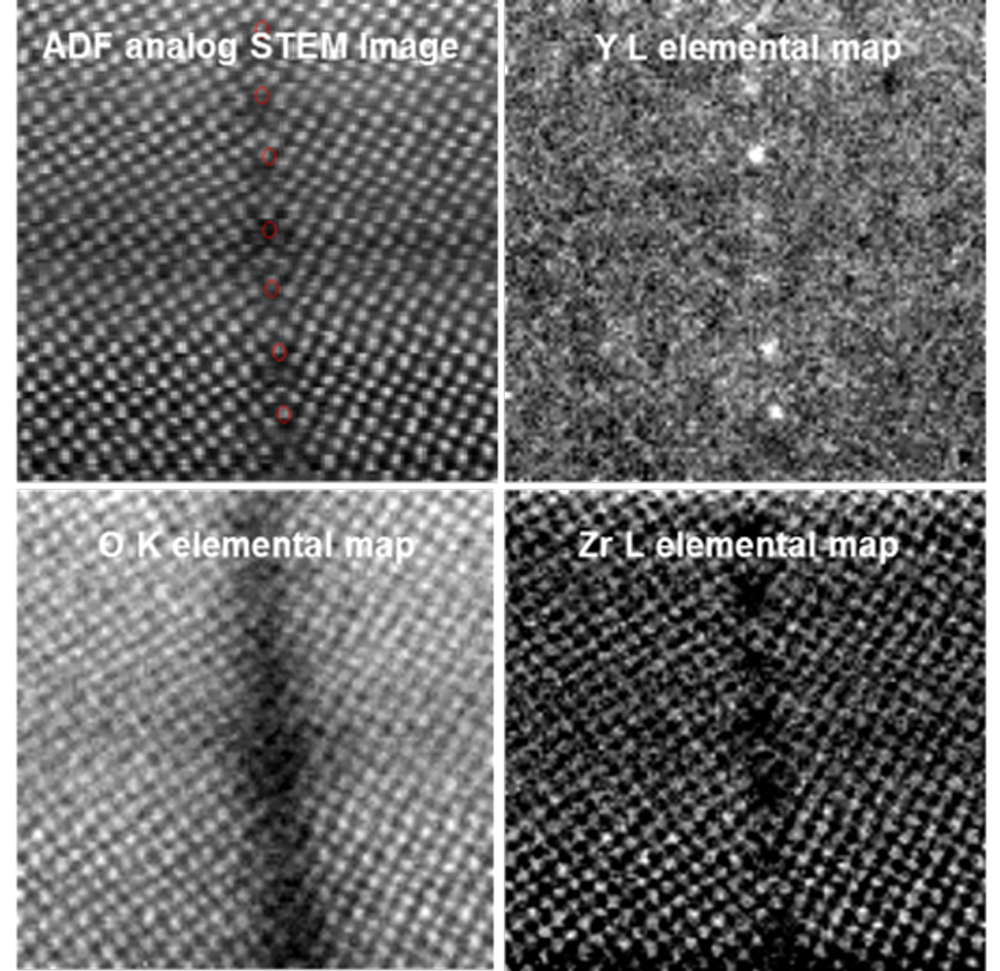
EELS analysis of metal segregation across grain boundary in Yttria-stabilized Zirconia (YSZ) – investigating oxygen vacancies
Paolo Longo, Ph.D., Gatan, Inc.
Microscope and sample courtesy of Dr. Maria Varela at Oak Ridge National Lab, Oak Ridge, TN
EELS data were acquired using a probe-corrected NION Ultrastem 200 TEM/STEM microscope equipped with C-FEG emission gun and a fully loaded Enfinium™ ER system.
Methods
Voltage: 200 kV; data taken in STEM mode; EELS core-loss spectrum (400 – 2400 eV): 40 ms; dataset size: 128 x 128 pixels
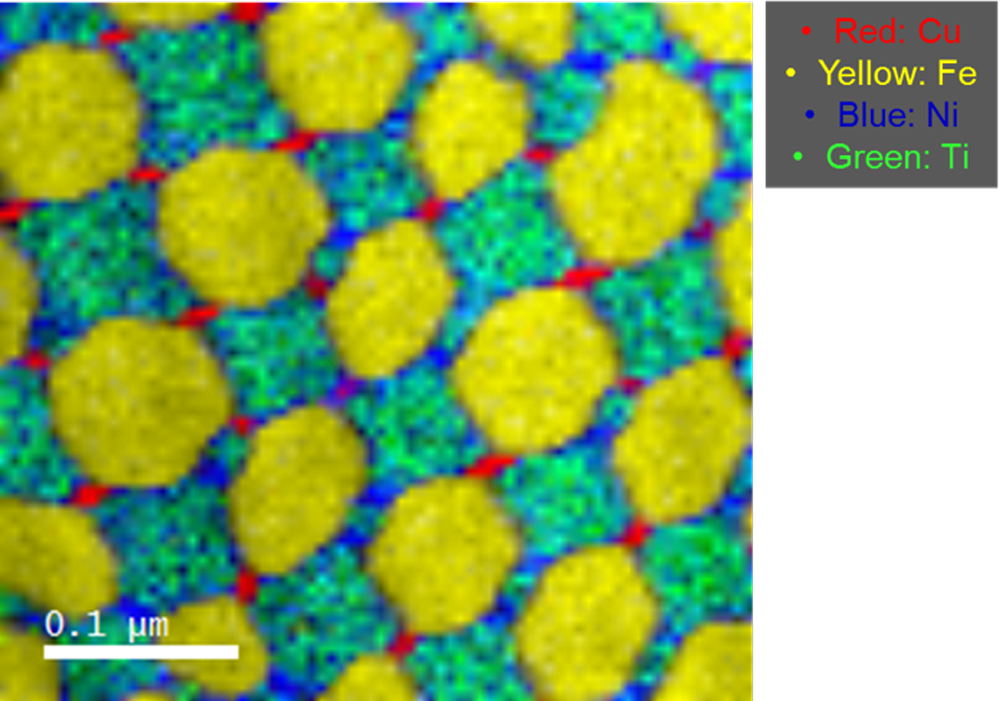
Fast EELS analysis of AlNiCo based metal alloy for magnetic purposes
Paolo Longo, Ph.D., Gatan, Inc.
Sample courtesy of Dr. Li Zhou at Ames Lab, Iowa
EELS data taken using a FEI F20 TEM/STEM microscope equipped with S-FEG emission gun and a fully loaded GIF Quantum® ER system.
Methods
Voltage: 200 kV; data taken in STEM mode; EELS spectrum (300 – 2300 eV) exposure time: 8 ms; total exposure time: <1 min
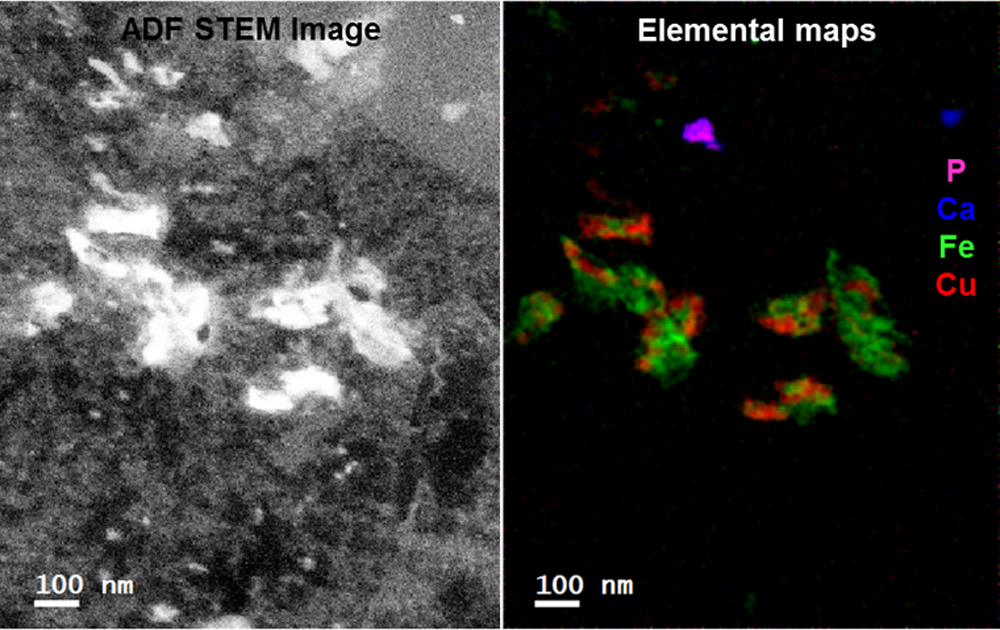
Fast EELS analysis of metals in a blood cell attacked by the malaria parasite
Paolo Longo, Ph.D., Gatan, Inc.
EELS data taken using a FEI F20 TEM/STEM microscope equipped with S-FEG emission gun and a fully loaded GIF Quantum® ER system.
Methods
Voltage: 200 kV; data taken in STEM mode; EELS spectrum (80 – 2080 eV) exposure time: 5 ms; dataset size: 216 x 272 pixels; total exposure time: 4 min
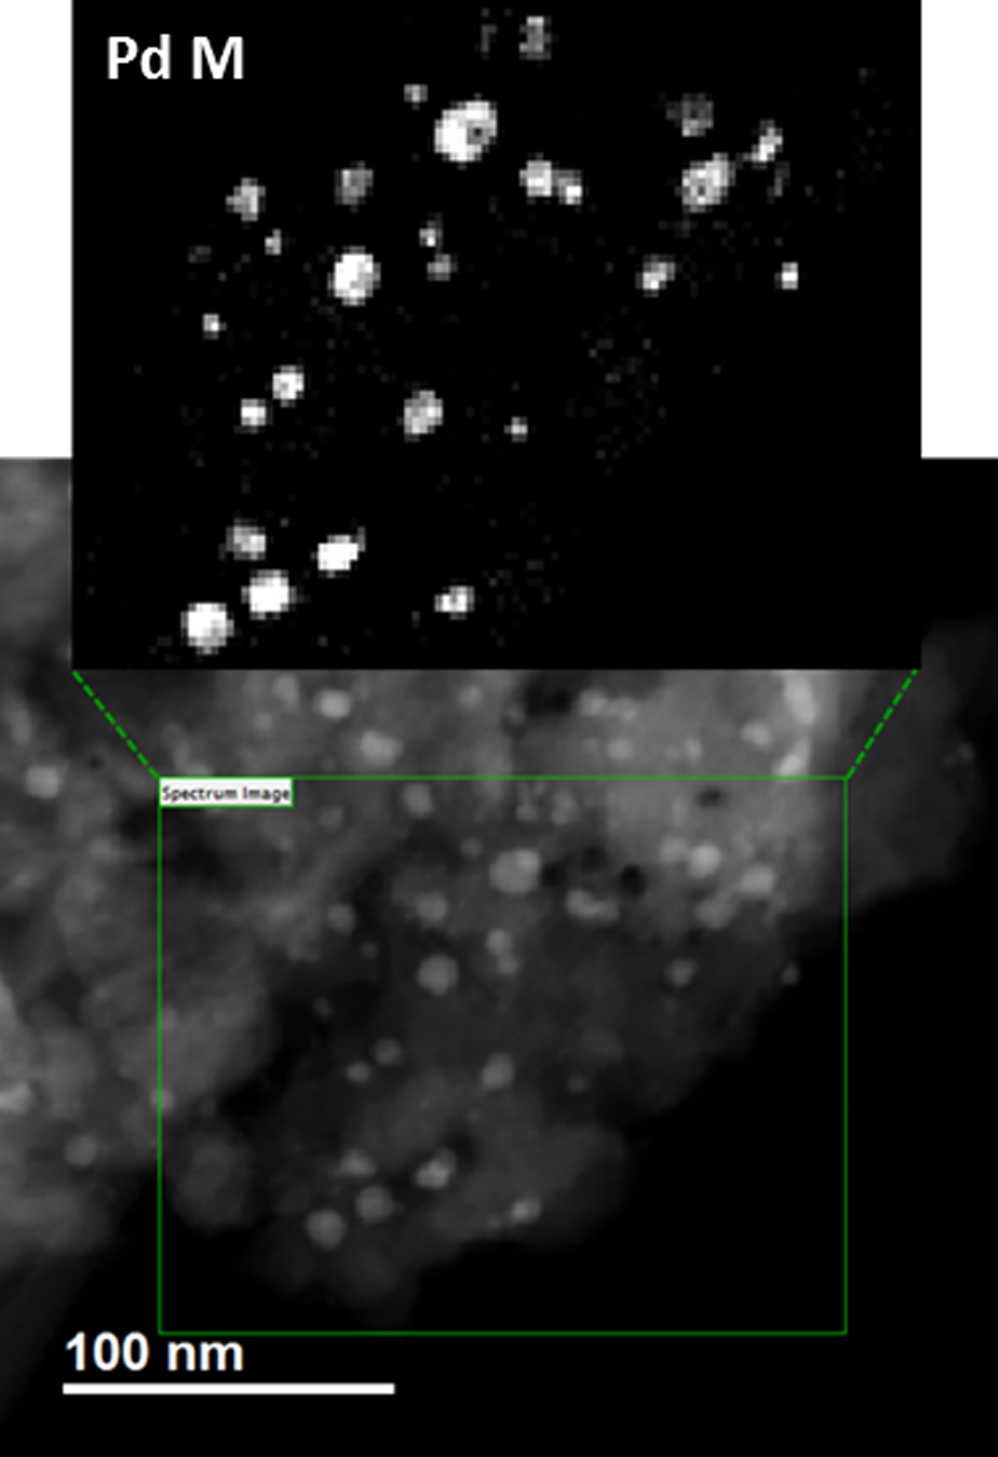
Fast DualEELS analysis of the distribution of Pd particles and their chemistry in zeolite
Paolo Longo, Ph.D., Gatan, Inc.
The EELS analysis shows how Pd particles chemically interact with support.
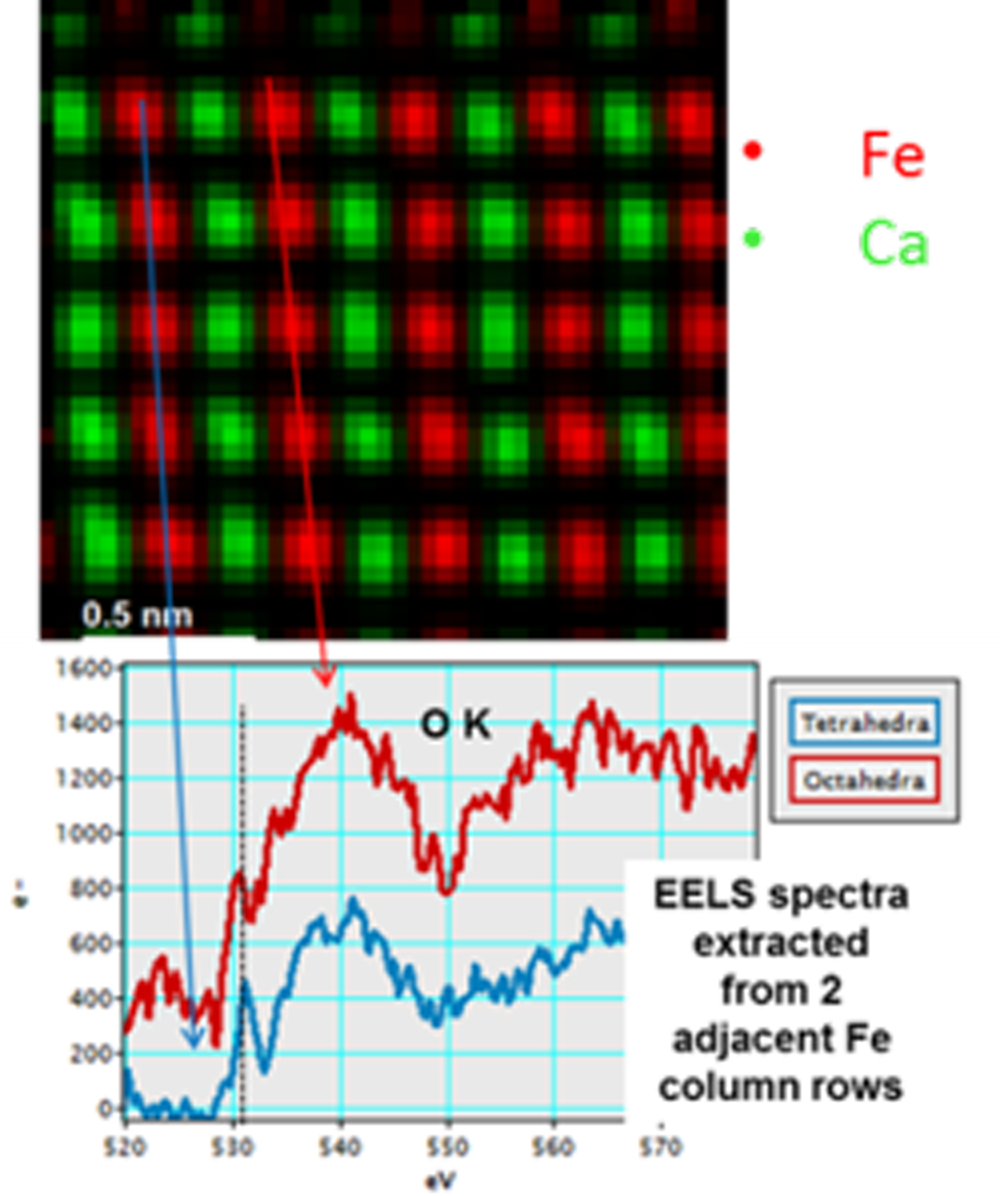
Atomic DualEELS analysis of CaFeO2,5 Brownmillerite structure—Investigating the presence of oxygen vacancies
Paolo Longo, Ph.D., Gatan, Inc.
Sample courtesy of Professor Ramachandra Rao at Indian Institute of Technology, Chennai Madras, India
Microscope courtesy of Dr. Giuseppe Nicotra at IMM-CNR, Catania, Italy
Fe-O atoms are arranged in alternating tetrahedral and octahedral planes that can be distinguished looking at the fine structure of the O K-edge at 532 eV. Hybridization between the O and Fe orbitals is different depending on the way the atoms are arranged, and changes can be seen in the O K-edge at 532 eV in the EELS spectrum.
First atomic EELS map acquired during volcano eruption
Paolo Longo, Ph.D., Gatan, Inc.
Sample courtesy of Dr. P. Rice and Dr. T. Topuria at IBM (Almaden), San Jose, CA
Microscope courtesy of Dr. Giuseppe Nicotra, IMM-CNR, Catania, Italy
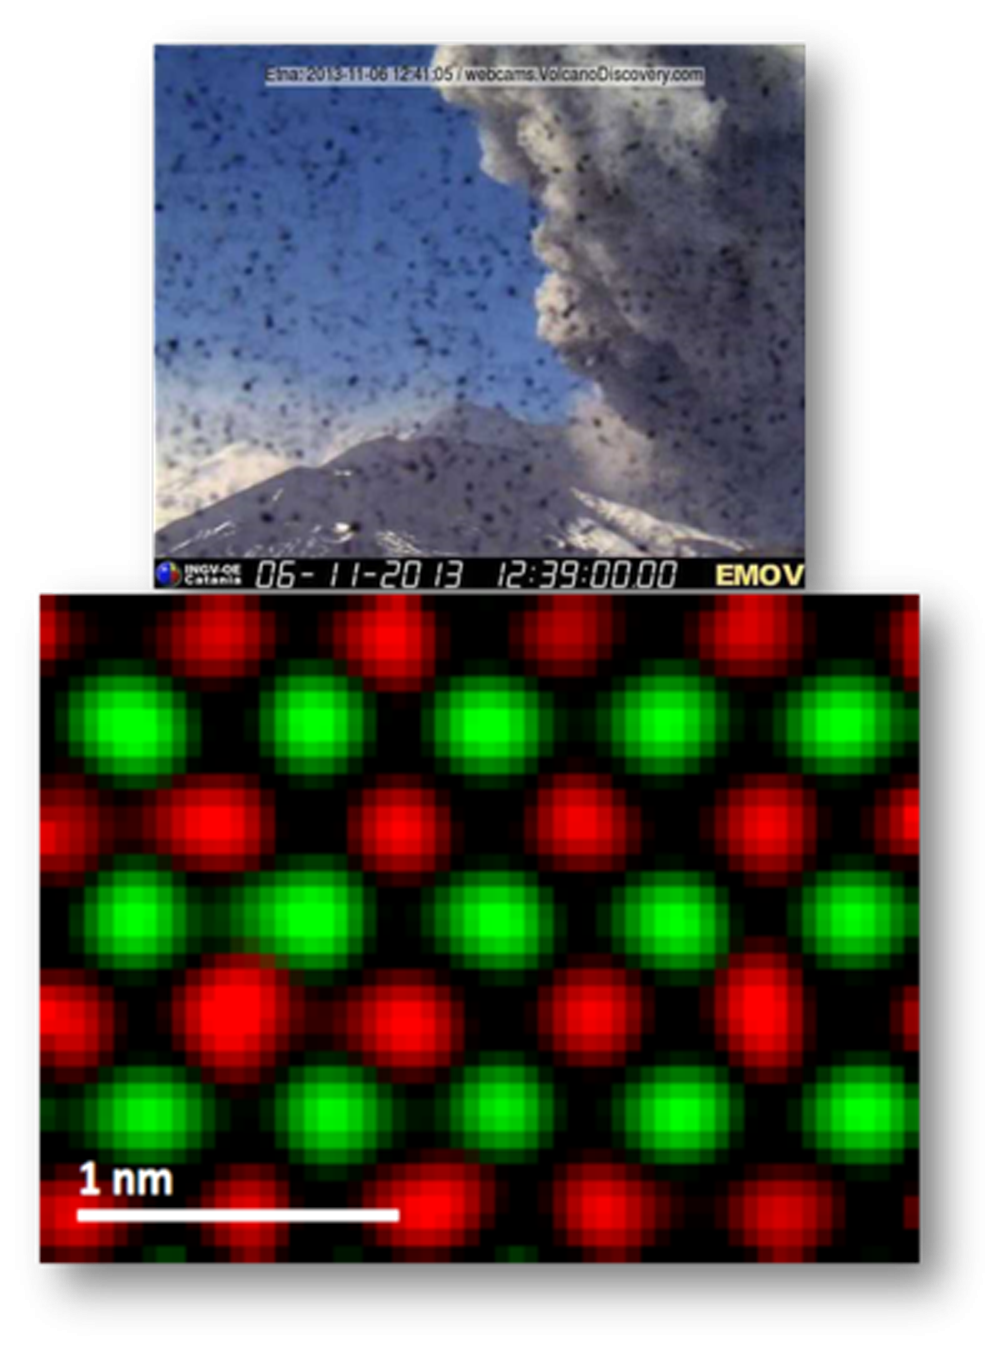
The lab where EELS maps were taken is situated at the slopes of Mount Etna in Sicily, Italy. Mount Etna is the highest active volcano in Europe. The EELS elemental maps were taken at high speed during major volcano eruption, as shown in the volcano webcam photograph above the maps.
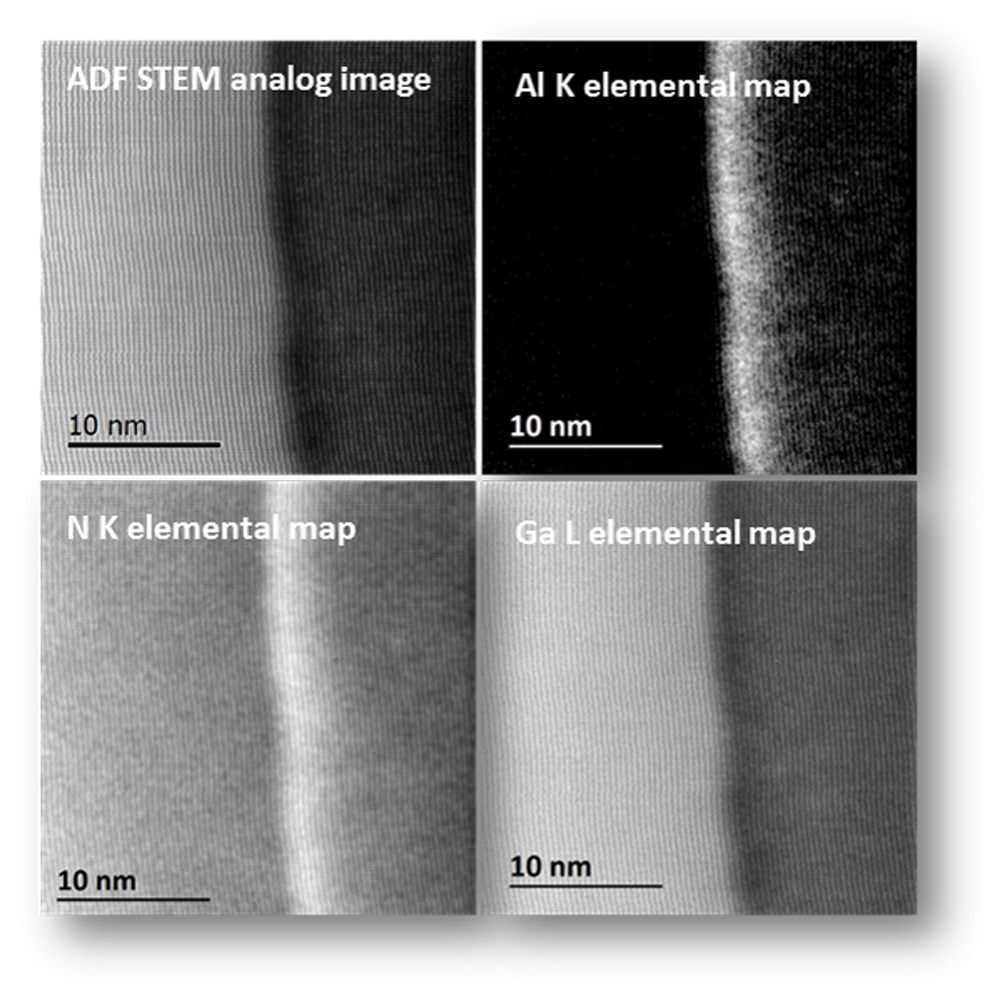
Fast atomic EELS analysis across the GaN/AlGaN interface
Paolo Longo, Ph.D., Gatan, Inc.
Sample courtesy of Dr. Giuseppe Nicotra at IMM-CNR, Catania, Italy
Microscope courtesy of Dr. Giuseppe Nicotra at IMM-CNR, Catania, Italy
Methods
probe-corrected ARM 200F TEM/STEM microscope
C-FEG emission gun
GIF Quantum® ER system
voltage: 200 kV
data taken in STEM mode
EELS core-loss spectrum (200 – 2200 eV) exposure time: 10 ms
beam current: 45 pA
dataset size: 250 x 250 pixels
total exposure time: 11 min
Pages
