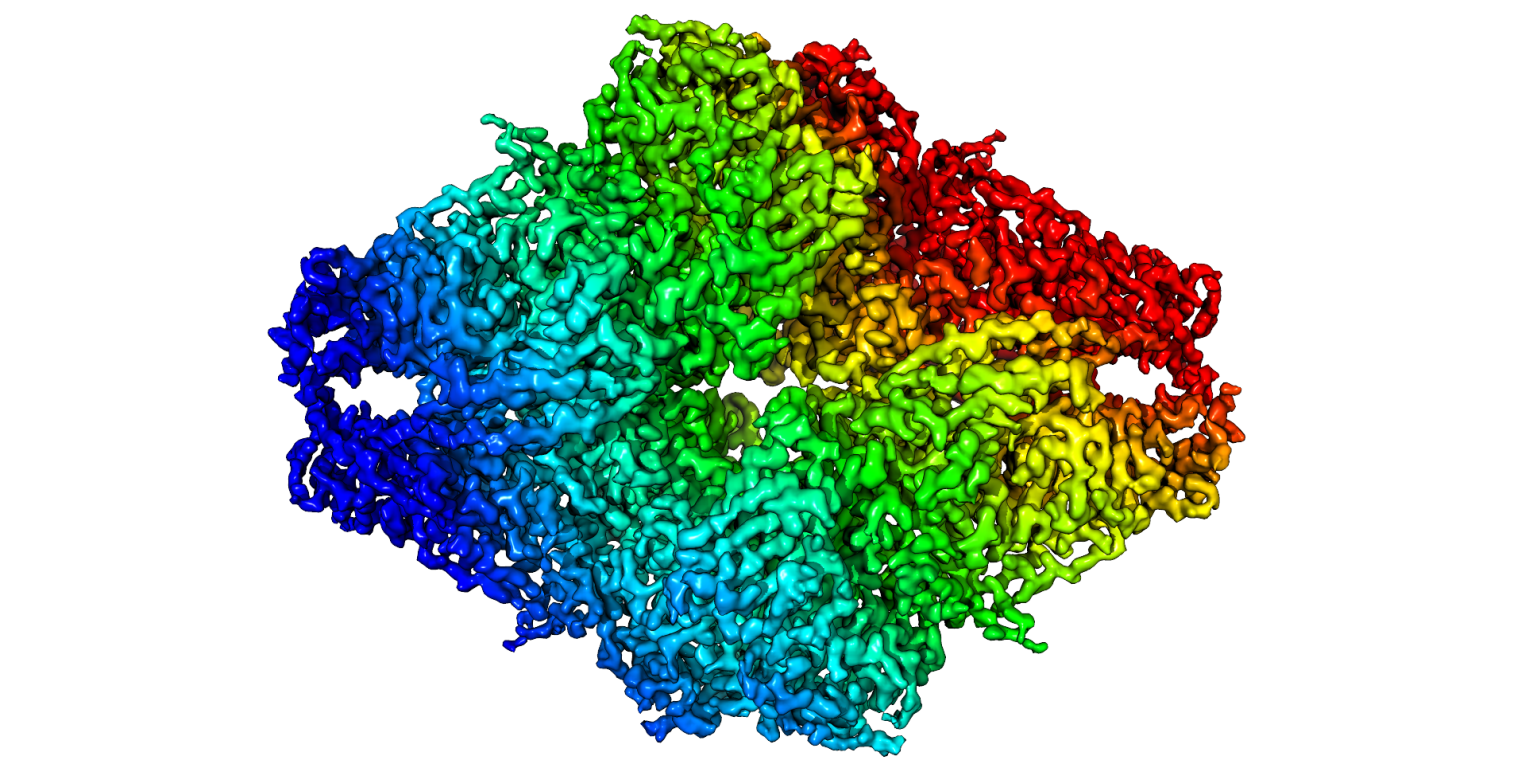
First 3.2 Å β-galactosidase structure solved by cryo-EM
Bartesaghi, A.; Matthies, D.; Banerjee, S.; Merk, A.; Subramaniam, S.
Structure of Escherichia coli β-galactosidase (∼465 kDa) at 3.2 Å resolution solved using the GIF Quantum LS energy filter that includes a K2 Summit camera. The first atomic model derived using single-particle cryo-EM analysis closely matches the 1.7 Å crystal structure with a global rmsd of ∼0.66 Å. Proc Natl Acad Sci U S A. 2014 Aug 12;111(32):11709-14.
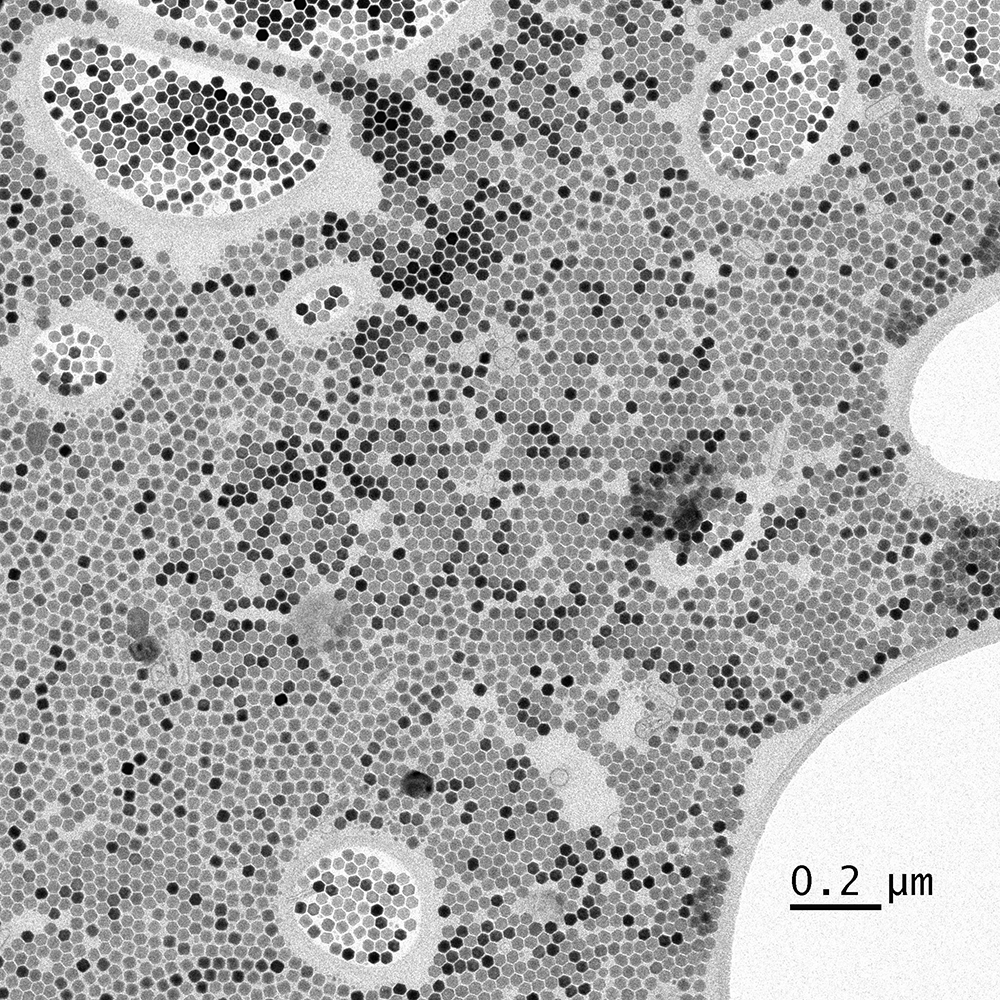
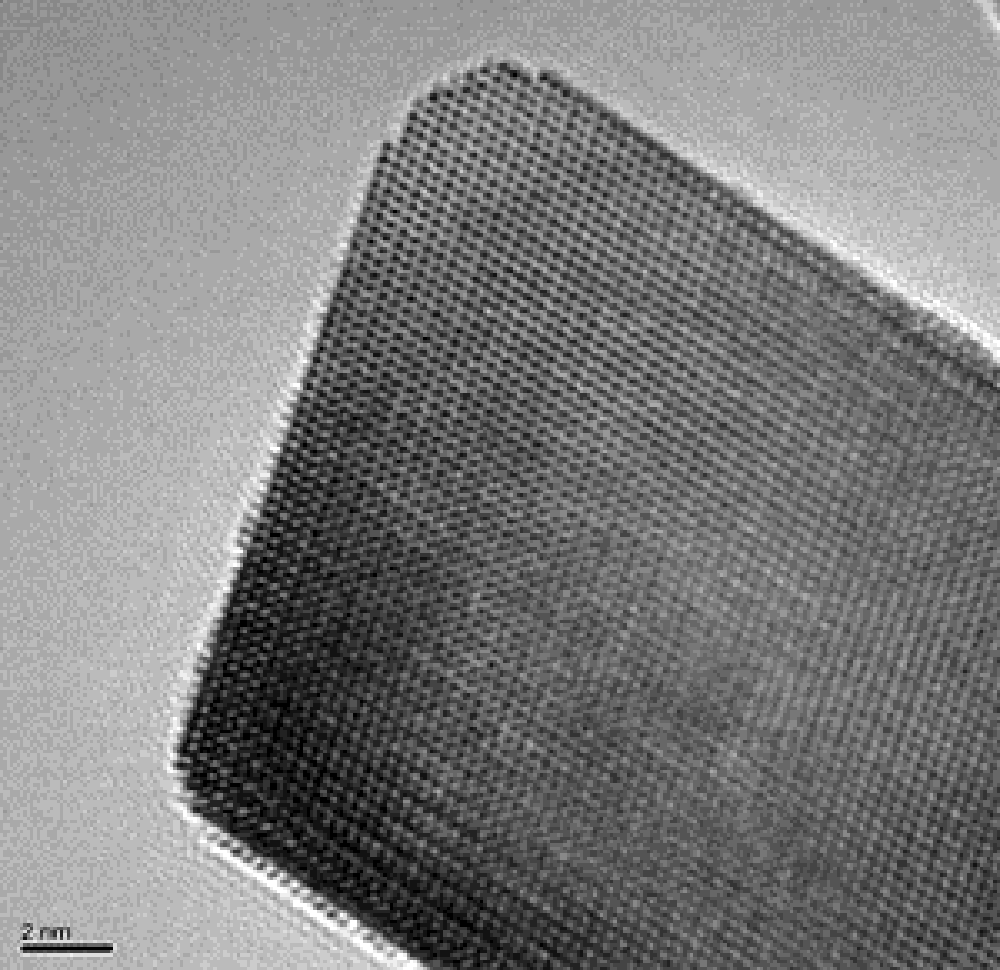
Nano-crystals
Image courtesy of the University of California - Berkeley, Dr. Kent McDonald.
Nano-crystals recorded with UltraScan® 1000XP CCD camera on a 120 kV TEM.
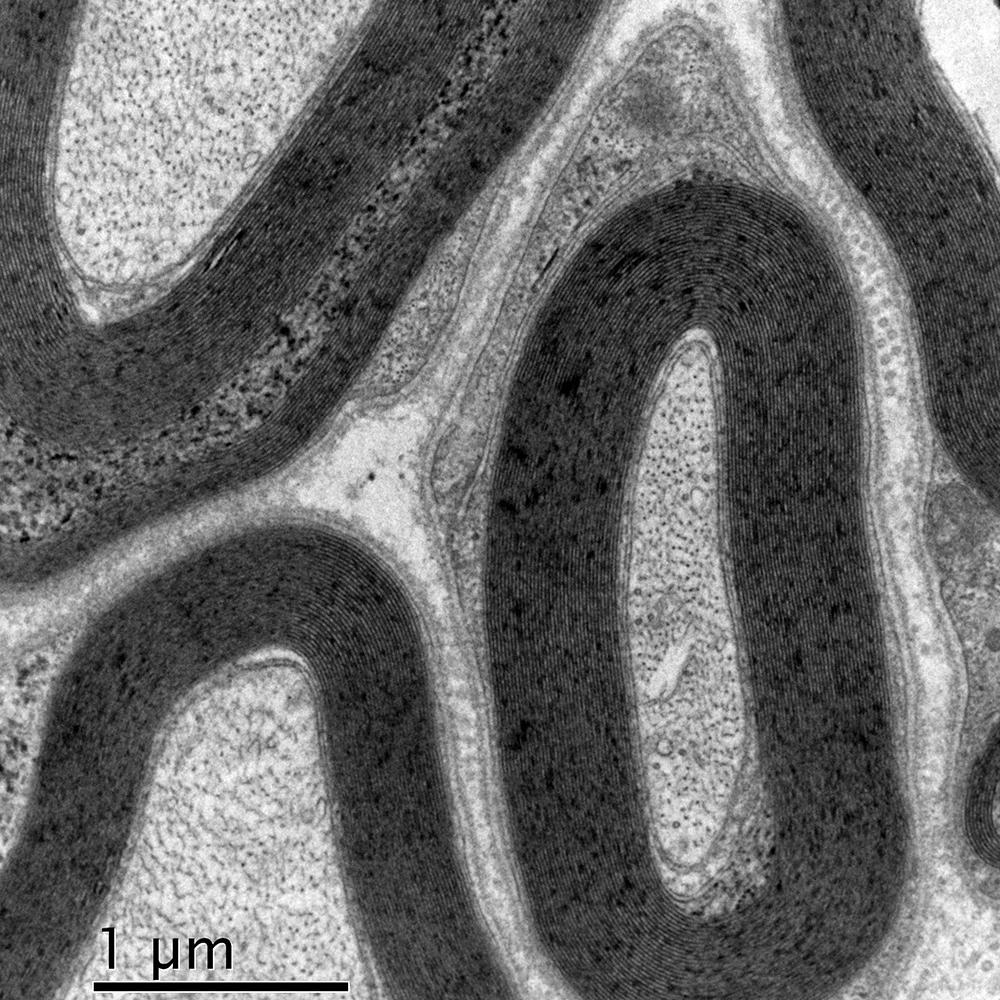
Myelinated nerve
Image courtesy of Kenneth L. Tiekotter, University of Portland.
Image of myelinated nerve recorded with Orius® SC1000W (35 mm mount) CCD camera.
Methods
recorded at 85kx at 80 kV
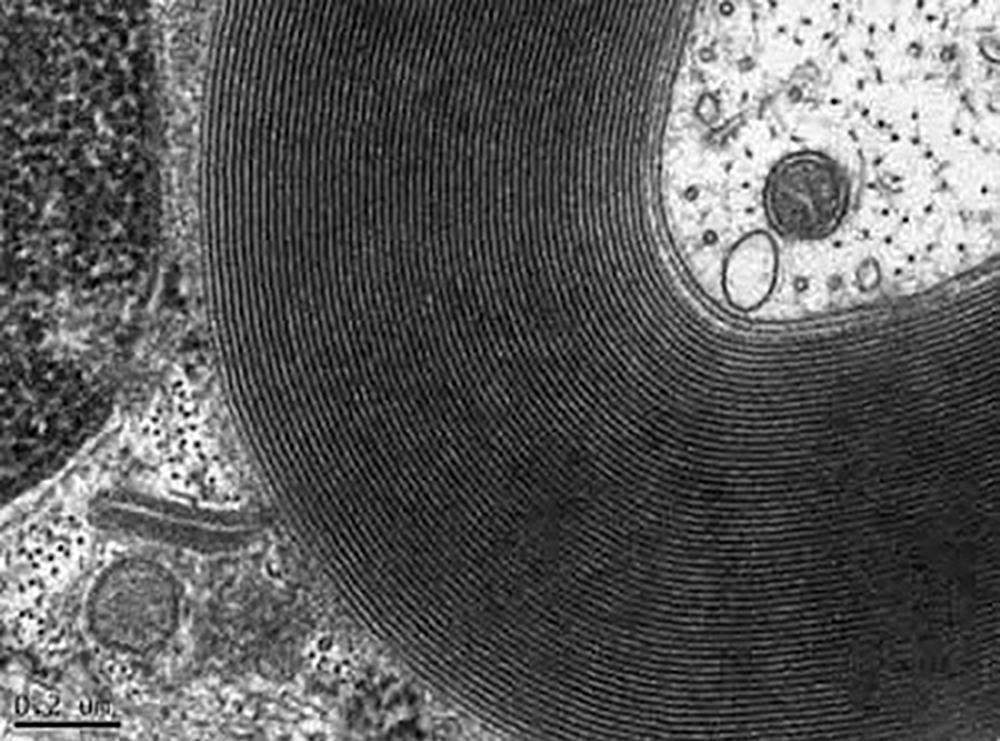
Lingual nerve
Methods
recorded at 13500x, 120 kV
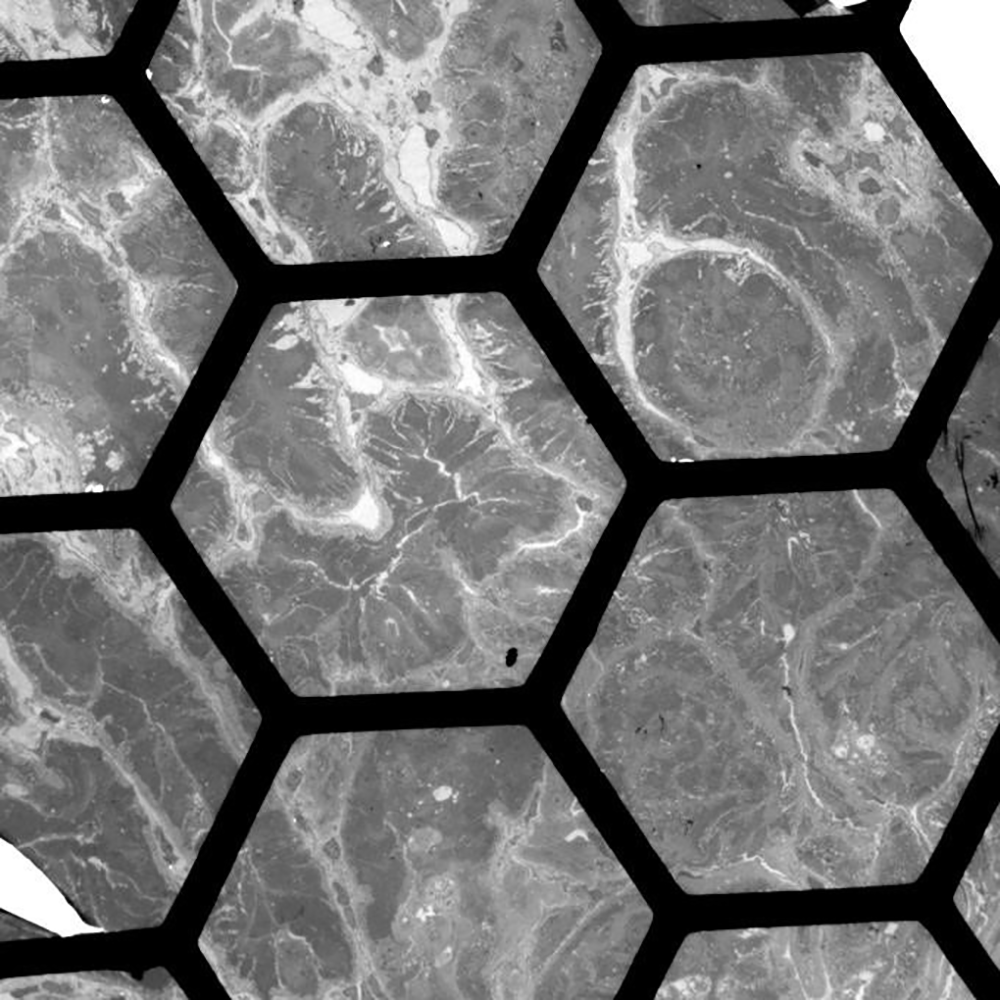
Kidney
Methods
recorded at 200x, 120kV
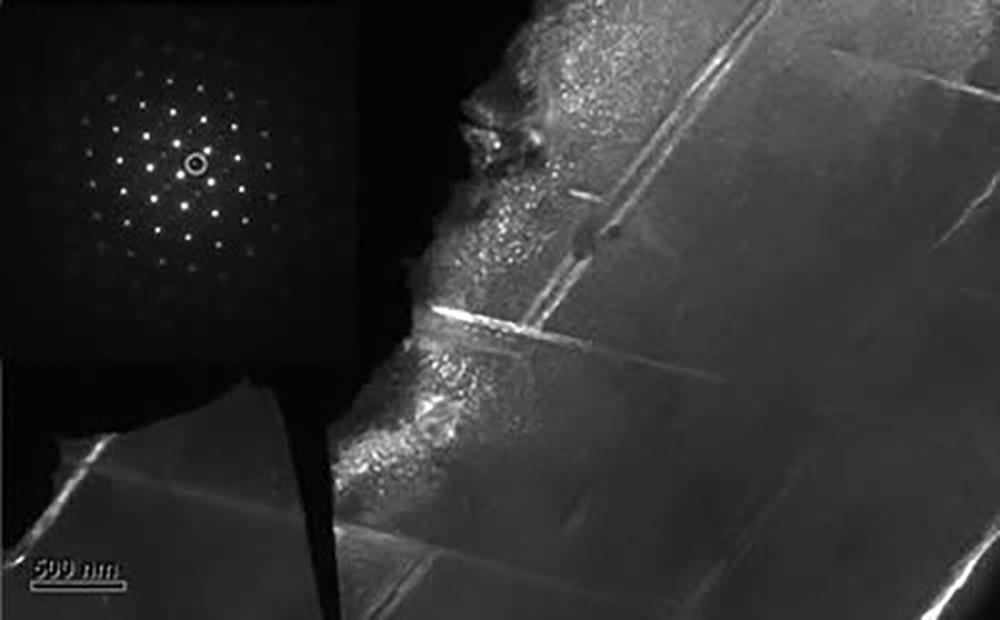
Dark field image from the encircled reflections in the SAED revealing nanoscale γ´´ and eta-Ni3Ti plate-shaped precipitates
Samples and images courtesy of Vijay K. Vasudevan, University of Cincinnati.
Dark field image from the encircled reflections in the SAED revealing nanoscale γ´´ and eta-Ni3Ti plate-shaped precipitates. The γ´´ has a DO22 structure, whereas the eta has a hexagonal structure. Inset: [011] SAED pattern from IN718 Ni-base superalloy showing reflections from the γ matrix, γ´´ precipitates and eta-Ni3Ti plate-shaped precipitates.
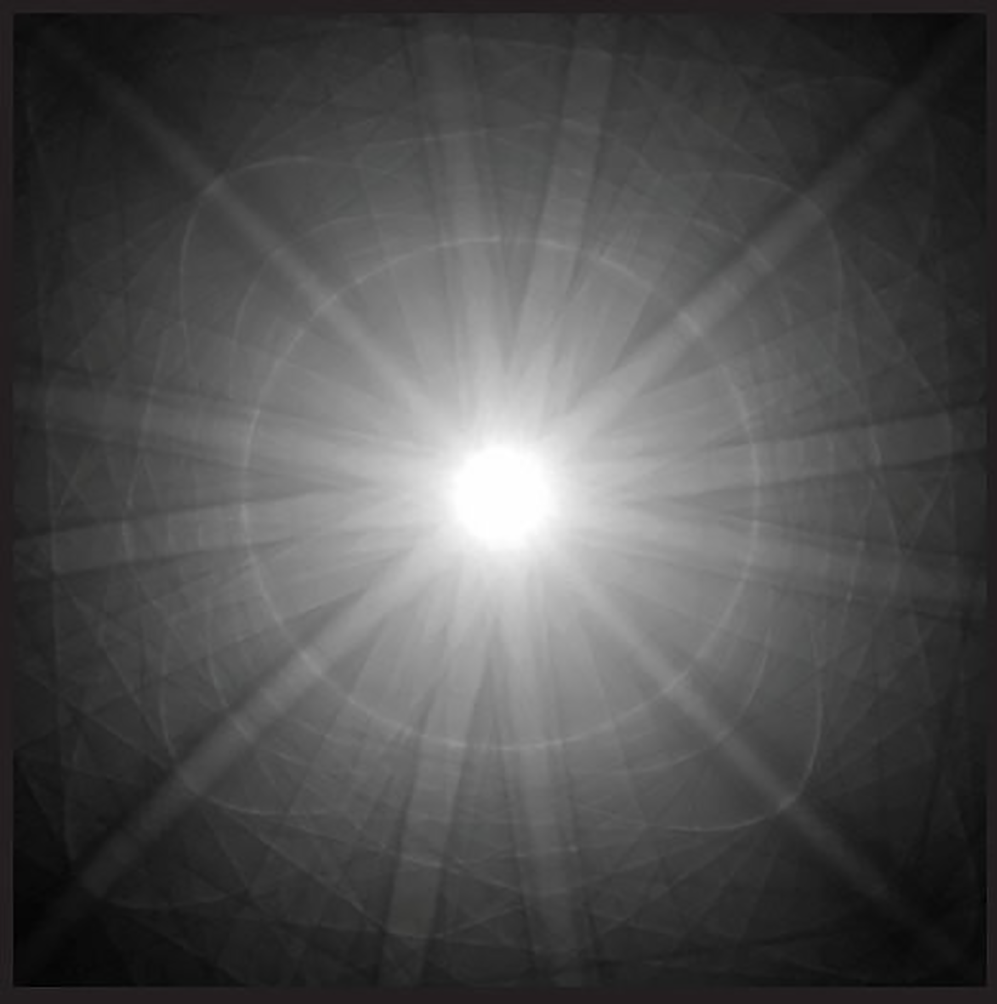
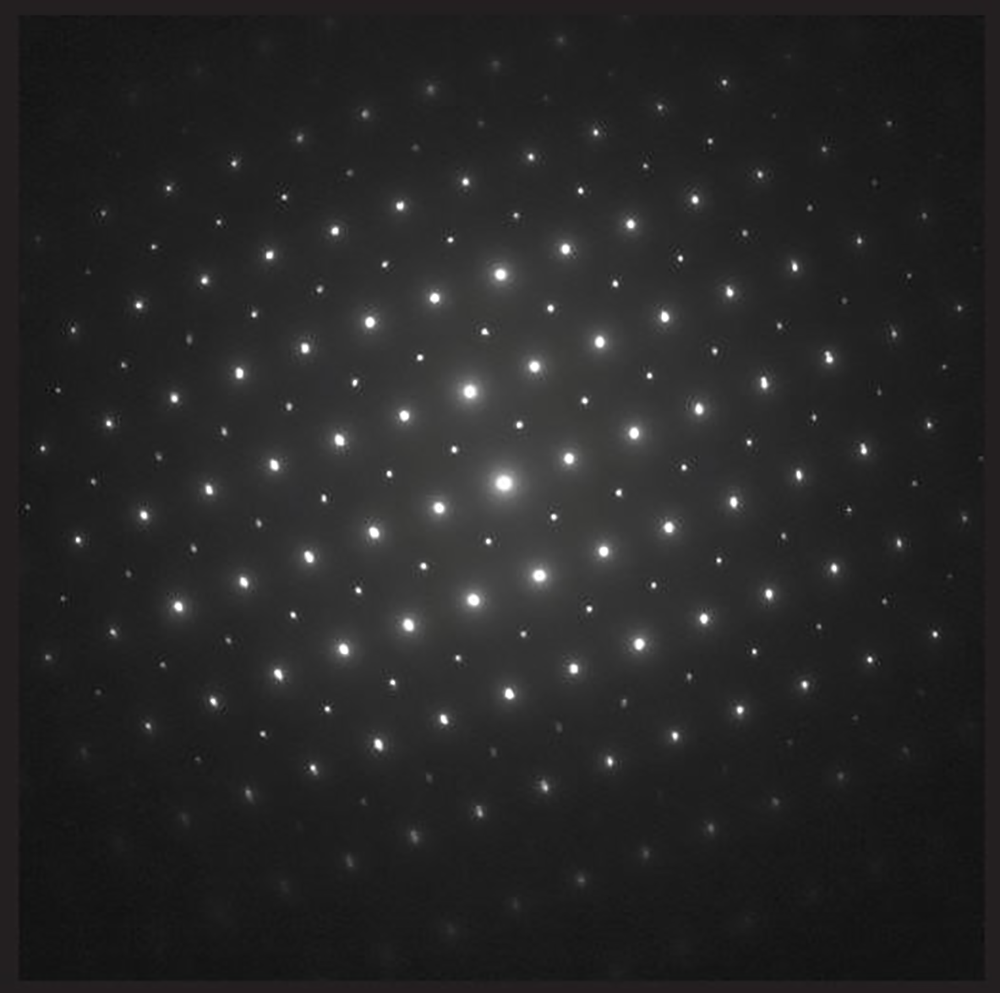
CBED pattern from LaCoO3
CBED pattern from LaCoO3 recorded with Orius SC200D CCD camera.
Methods
camera length of 135 mm
exposure time of 1 s (average of 30 frames)
spot size #9 at 200 kV
image is displayed on logarithm scale
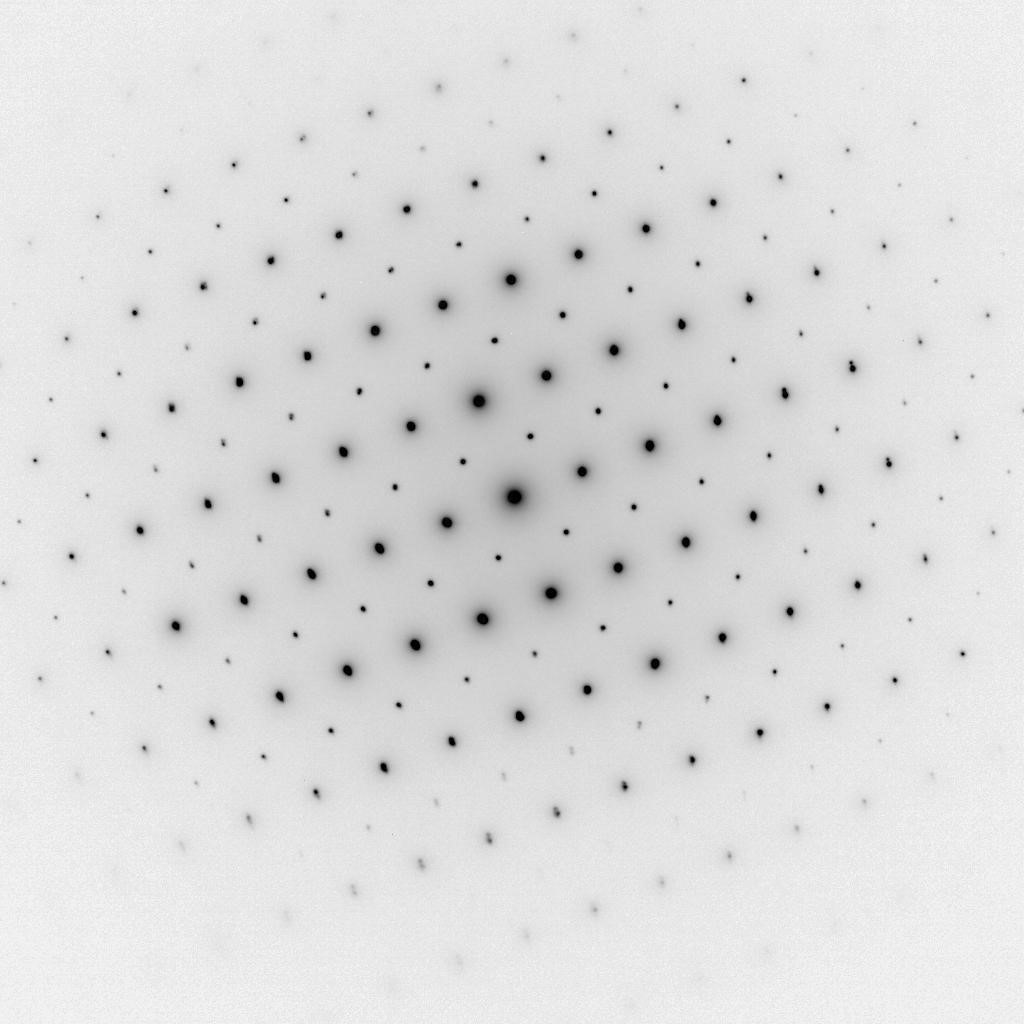
SAED pattern from LaCoO3 (Image 2)
SAED pattern from LaCoO3 recorded in reverse contrast with Orius SC200D CCD camera.
Methods
camera length of 600 mm
exposure time of 10 s
spot size #4 at 200 kV
SAED pattern from LaCoO3 (Image 1)
SAED pattern from LaCoO3 recorded with Orius SC200D CCD camera
Methods
camera length of 600 mm
exposure time of 10 s
spot size #4 at 200 kV
HREM image of active catalytic nanoparticle of ceria zirconia
Image courtesy of Ruigang Wang and Peter Crozier, Center for Solid State Science, School of Materials, Arizona State University, USA.
HREM image of active catalytic nanoparticle of ceria zirconia recorded with Orius SC600 camera in an environmental TEM operating at 200 kV. Cerium atomic columns appear as black dots in the image.
Pages
