Data courtesy of Dr. R. Williams, Ohio State University.
Cathodoluminescence analysis on GaN/AlN nanowires
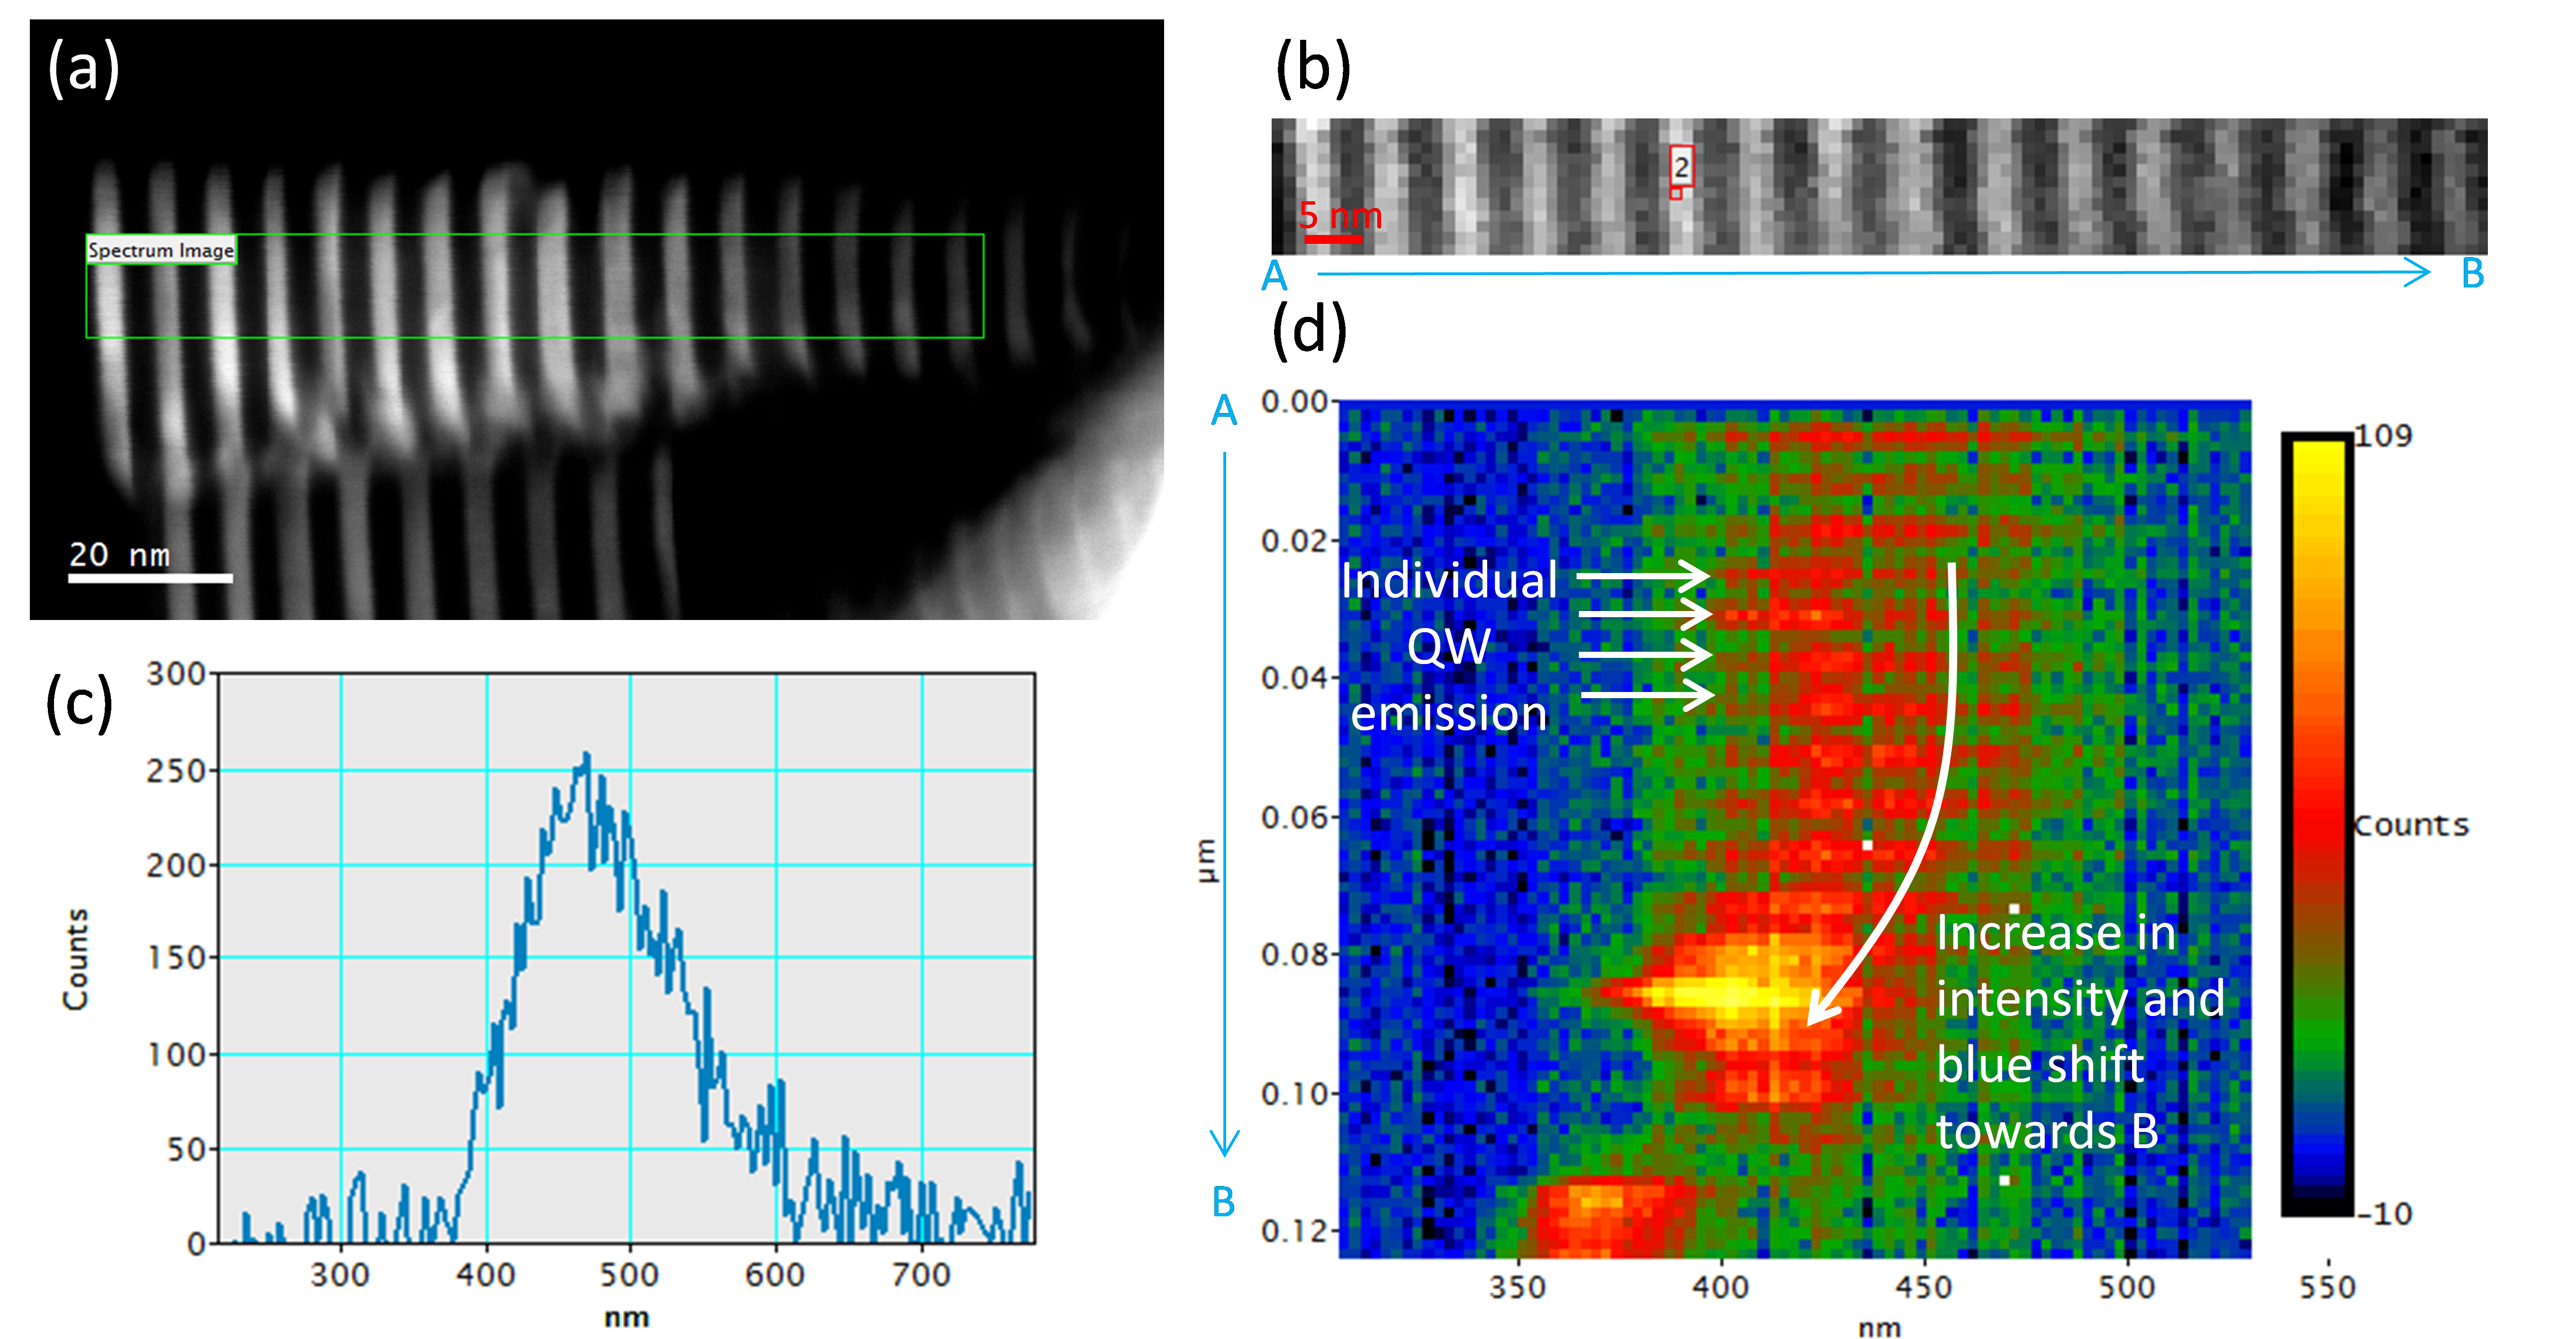
a) Dark field STEM image of GaN/AlN heterostructure nanowire with nominally 3 nm thick GaN quantum wells and 4 nm thick AlN barrier layers; GaN is bright in DF image; (b) Cathodoluminescence (CL) spectrum-image acquired from region indicated by green rectangle in (a) with intensity at 491 ±10 nm displayed; (c) Single CL spectrum extracted from the spectrum-image at point 2 as displayed in (b); (d) Projection of the CL spectrum with information along y-axis (radial axis of the nanowire) summed into a single value. Resultant data set shows spectral information as a function of position along nanowire length. Luminescence from individual quantum wells was resolved readily, and an increase in luminescence intensity and a blue shift in the emission peak were also observed toward the narrow end of nanowire.
Methods
Acquired using FEI probe corrected Titan3™ 80-300 TEM/STEM
80 kV
Room temperature.

