The characterization of beam-induced phase changes with in-situ EELS
Introduction
The ability to follow changes in a sample over time or as a function of input stimuli is at the heart of in-situ analysis. Traditionally, imaging has been the primary method to follow in-situ changes via electron microscopy. Still, spectroscopic imaging tools such as electron energy-loss spectroscopy (EELS) spectrum imaging (SI) have also been increasingly employed. However, the finite read-out noise of traditional, optically coupled CCD and CMOS sensors has hindered the application of in-situ EELS spectrum imaging (EELS SI) to monitor chemically sensitive yet weak core-loss events. With the adoption of direct detection for EELS [1], which is primarily limited only by Poisson statistics, in-situ EELS SI using core-loss edges becomes more feasible and opens the door to monitoring sensitive changes in bonding and chemistry with both high spatial and temporal resolution. As a corollary, dose-fractionated EELS SI can be used as the standard mode for multi-pass data collection, allowing the correction of sample drift, the removal of compromised passes post-acquisition, and summing only those passes acquired from the sample in a pristine state. This is made possible by Gatan’s eaSI™ technology, which enables hardware synchronization and a streamlined workflow for setting up and acquiring continuous multipass spectrum imaging with inline drift correction.
In this application note, we use electron energy-loss near-edge structure (ELNES) to monitor the chemical changes of a calcium carbonate sample as it is subjected to electron irradiation and propose a reduction mechanism.
Experiment
Commercially available calcium carbonate (CaCO3) is used as a model system for this study, as the total dose thresholds for reduction and mass loss are well characterized [2,3]. The calcium carbonate nanoparticles were dispersed in distilled water and drop-cast onto 25 nm-thick SiN membranes. STEM spectrum images were acquired on a JEOL F200 at an accelerating voltage of 200 kV and a probe current of 96 pA. The spectrum images were acquired using DualEELS, with a pixel dwell time of 0.004 s/pixel (0.001 for the low loss and 0.003 s for the high loss). A pixel size of 1 nm was used, with a 4 x 4 subpixel scanning array, which prevented overlapping of the probe with neighboring subpixels (the probe diameter is less than 2 Å). Subpixel scanning spreads the dose over the entire pixel rather than just the pixel center. The newly released in-situ SI features in DigitalMicrograph® 3.6 were used to save each pass individually. An energy-drift correction was applied in this case live, using ZLP lock, but it can also be corrected post-acquisition throughout the full SI stack. Spatial drift alignment may also be corrected live, using continuous scanning and drift correction or post-acquisition. All EELS spectrum images were acquired at room temperature (25 °C).
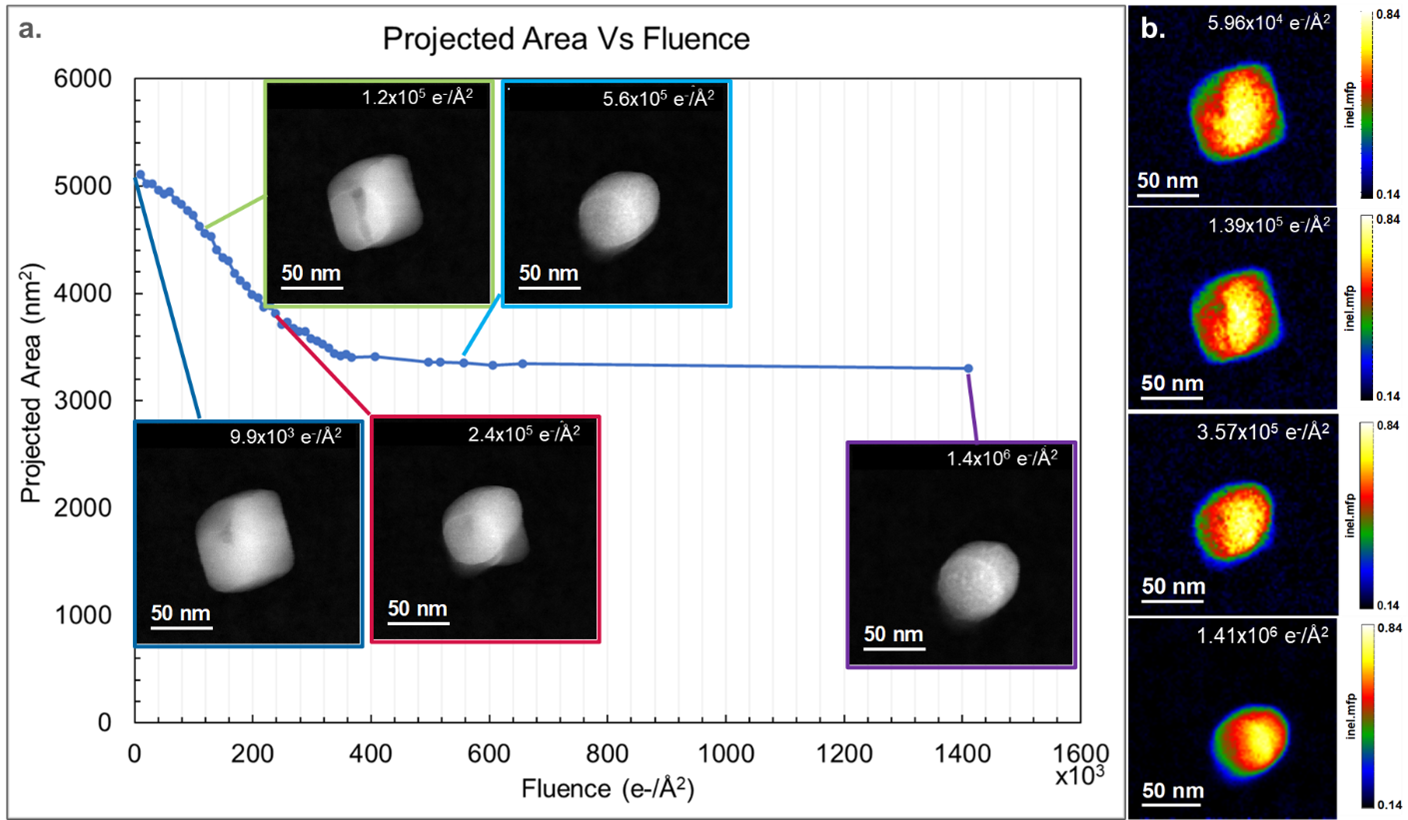
The projected area of CaCO3 particles decreased as a function of the total dose and is plotted in Figure 1a. Morphological changes in the particle are also observed as the total dose increases, and the CaCO3 particle goes from having a cube-like shape with faceted edges to having an oblong shape with round edges, as evident in the embedded ADF Images. In Figure 1b, the relative thickness of the particles also decreases with increasing dose. Together with the observed decrease in projected area observed in Figure 1a, it is confirmed that volume, and hence mass loss, occurs through the sublimation of its constituents (radiolysis).
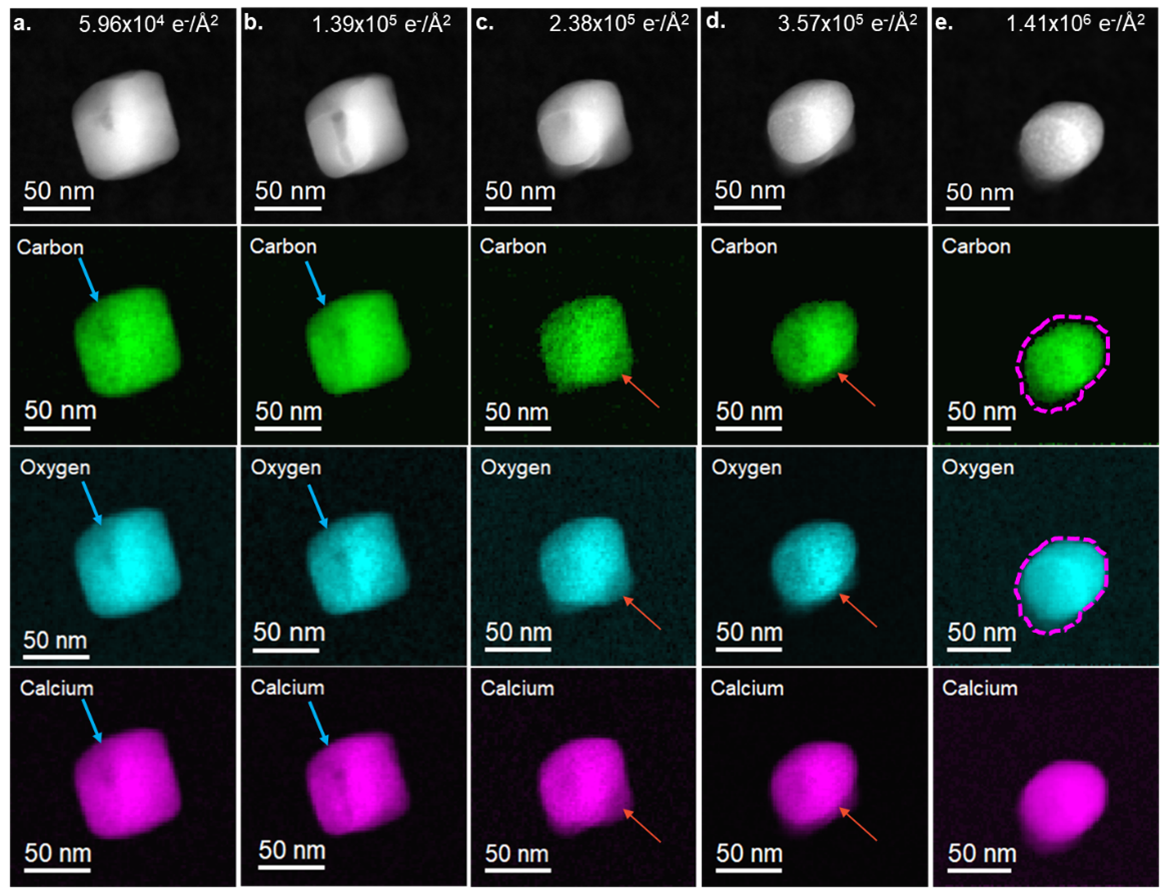
Using the in-situ tool palette in DigitalMicrograph 3.6, in-situ spectrum images can now be spatially aligned, cropped, and summed to investigate the effect of increasing specimen dose on the calcium carbonate specimens. A previous study showed that the average composition of CaCO3 particles changes with increasing fluence [2]. Combining the new capabilities of in-situ spectrum imaging, the increased collection efficiency of the GIF Continuum®, and the sensitivity of the K3® camera, it is now possible to collect elemental maps at discrete total fluences. This provides the ability to correlate local changes in composition with changes in morphology. In Figure 2, spectrum images were extracted at discrete steps of fluence, where apparent morphological changes were observed. The elemental maps were created from the C K, O K, and the Ca L2,3 edges. The most significant changes in areal density (a decrease in contrast) were observed in the C and O maps, while the overall intensity in Ca maps remained constant. Darker areas of contrast in the ADF images, highlighted by the blue arrows in Figures 2a and 2b, correspond spatially with a decrease in C, O, and Ca density. The decrease in intensity in the ADF images and the elemental maps is likely due to the heterogeneous nucleation of a void, which was observed to propagate through the particle with increasing fluence. This inhomogeneity in void formation may result from defects where the threshold for nucleation is lower [2]. Changes in the particle morphology are observed to occur inhomogeneously in the elemental maps. In Figures 2c and 2d, rounded edges have formed at the particle's top, left, and right. However, a facet remains at the bottom of the particle and is highlighted by the red arrow. As the fluence increases, the facet propagates toward the center of the particle in both the ADF and the elemental maps. The particle obtains an oval shape after a total fluence of 1.41 x 10⁶ e-/Å2. Previous studies hypothesized that the reduction of CaCO3 to CaO occurred isotropically, starting from the edges of the particles and propagating towards the center [2]. However, the elemental maps and the ADF images in Figure 2 show that the reduction of CaCO3 is anisotropic. In the final elemental maps in Figure 2e, the outline from the Ca map is projected onto the particle in the O and C maps (dotted magenta line). The projected area of the C signal was measured to be 3046 nm2 (±116 nm2), while the O and Ca signals were measured to be 4019 nm2 (± 128 nm2) and 4335 nm2 (± 130 nm2), respectively. This supports the radiological reduction of CaCO3 through the loss of C and O. The formation of CO2 was observed during the thermal decomposition of CaCO3 in air, with the final reduced product being CaO [3]. However, in Figure 2e, the projected area of carbon is 30% smaller than the projected area of O. This suggests that either a higher concentration of C is lost compared to O during radiolysis or that a porous network of CaO has formed with a remnant carbonate phase. The latter would be more consistent with what was seen in previous studies, where pores were observed to form in STEM BF images during the reduction of CaCO3 particles [2]. Upon closer observation of the elemental map of C in Figure 2e, subtle variations in intensity (density) are observed, suggesting that a porous network in the remaining C has formed.
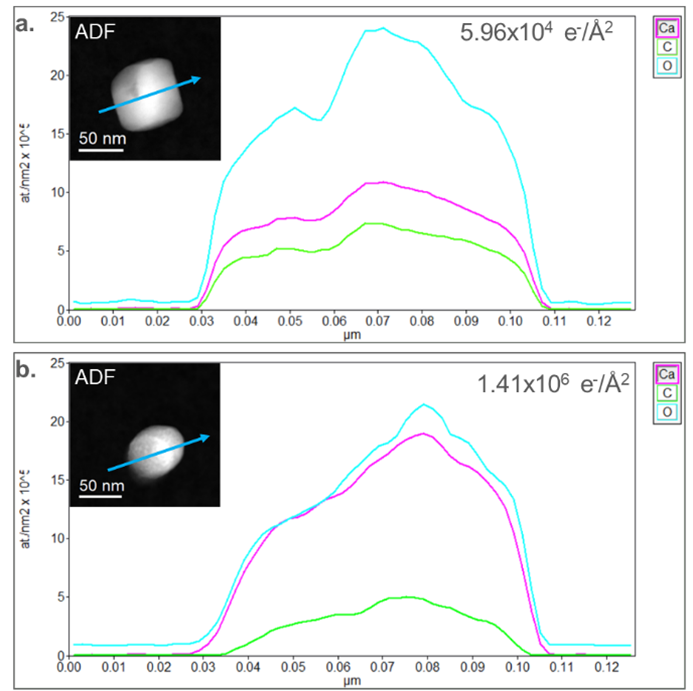
In Figure 3, concentration profiles were extracted from the initial (Figure 2a) and final (Figure 2e) elemental maps. The concentration profiles were extracted from a region across the particles, identified by the blue arrows in the embedded ADF images in Figure 3. In the initial elemental map, the stoichiometry deviates from the nominal CaCO3 (Figure 3a). O is measured to have a 2.2:1 ratio (nominally 3:1) with Ca, while a 3.2:1 ratio (nominally 3:1) is observed relative to C. This discrepancy from the nominal value could be partially due to variation during synthesis but mainly occurs through electron beam damage. The concentration profile extracted from the final state of the particle in Figure 3b shows an O-to-Ca ratio closer to 1:1. In contrast, the O-to-C ratio increased to 5:1. This increase in Ca density and decrease in O density correlates with previous studies which observed the formation of CaO during radiolysis. The density of O in the middle of the particle is slightly higher than at the edges of the particle, which further suggests that there is a remnant CaCO3-like phase and that the particle has not been fully reduced.
The ELNES can be used to study local changes to the electronic structure, exposing information about how bonding and crystal symmetry change with fluence. Stacked plots in Figure 4 show changes to the ELNES of the C K, Ca L2,3, and O K edges after different total fluences. The C K-edge in Figure 4a edge shows the most subtle changes with increasing fluence. The starting shape of the ELNES is characteristic of carbonates and shows four distinct peaks a-d [5,6]. The initial sharp peak at 289 eV arises from the transition to the unoccupied π̽ orbital in the CO32- anion, while the broad peak at 301 eV arises from the transition to the unoccupied σ̽ in the CO32- anion [6]. The shoulders a and b on the σ̽ peak are thought to be scattering from occupied shells surrounding the CO32- cluster [6]. With increasing fluence, the shoulder a and b on the σ̽ are the first to disappear, which suggests that the local symmetry surrounding the CO32- anions decreases. The π* peak gradually decreases in intensity while the σ̽ broadens. However, both the π̽ and σ̽ are present in the final state of the particle, which means that C and O are still bonded to one another in the particle. A very subtle π̽ peak like the π̽ peak of amorphous carbon (c-c bond) can be observed after a fluence of 2.38 x 10⁵ e-/Å2 and increasing intensity. The C-K edge acquired from an amorphous carbon film is plotted at the top for reference.
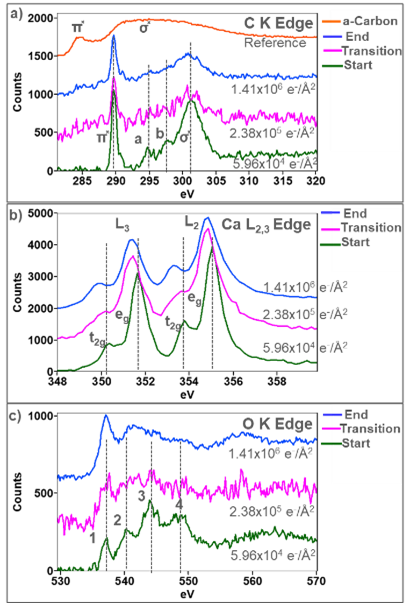
In Figure 4b, a 1.26 eV split between the eg and t2g peaks in the Ca L3 and L2 edges is observed and is consistent with the Ca L2,3 acquired from a pristine CaCO3 sample. As the total fluence increases, the split between the eg and t2g decreases, which indicates a change in the crystal field splitting energy. The crystal field splitting of the Ca L2,3 edge is highly sensitive to changes in local symmetry around the Ca ions. Rez and Blackwell showed a similar reduction in the eg and t2g split between crystalline and amorphous CaCO3. [7]. As the fluence increases, the L3 and L2 peaks are observed to shift to lower energies, and the splits between the eg and t2g increase to 1.4 eV, which is consistent with the fine structure acquired from CaO [3, 8]. Golla-Schindler et al. observed the same transition, where CaCO3 reduces to an amorphous/disordered phase before re-crystalizing to crystalline CaO [5].
In Figure 4c, the O K-edge initially has four distinct ELNES peaks labeled 1 – 4, consistent with the O K ELNES shape previously reported for CaCO3 [3]. Peak 1 results from hybridization of the O 2p and Ca 3d orbitals [4,9]. This peak is present as the fluence increases, suggesting that Ca is always bonded to O through the transition from CaCO3 to CaO. Peaks 2-4 can be assigned to the hybridization of the O 2p with S orbitals. The shape of the O K edge in this region is dictated by the hybridization of the O 2p state with the Ca 4s and C 2s states [9]. As the fluence increases, peaks 2 – 4 disappear, indicating Ca reduction and carbon removal from the CO32- anion. The final shape of the O K-edge resembles the ELNES previously observed in CaO [3]. However, a third peak was previously observed in the O K ELNES acquired from CaO, and it is not in the final spectra in Figure 4c. The absence of a definitive third peak in the final spectra suggests that the CaO phase has formed, but a large number of O vacancies are present. The ELNES analysis shown in Figure 4 was intentionally performed using spectra summed over the full particle area to determine an average of how the ELNES fingerprints varied with increasing fluence. However, the high sensitivity of the K3 camera allows for analysis of the ELNES to be performed from far fewer component spectra. Phase maps were, therefore, also generated at higher spatial resolution, enabling fine structure changes to be investigated locally across the particle.
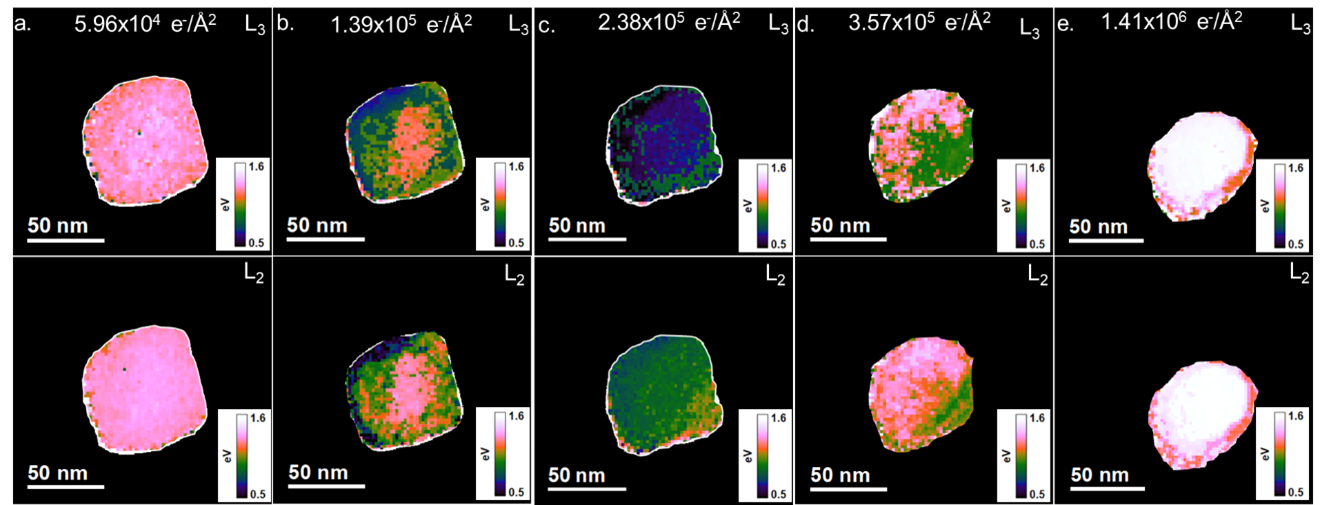
In Figure 5, the split between the eg and t2g peaks of the L3 and L2 edges were plotted as a function of position across the particles ( E(eg)-E(t2g)). The peak positions were determined by non-linear least squares fitting of Gaussian functions to each peak in the L3 and L2 edge using the least squares (LLS) tool palette in DigitalMicrograph. The most significant split is initially observed in the center of the particle and decreases closer to the edges. As the total fluences increase, a gradient in the eg-t2g split occurs. The eg-t2g split is smaller at the top and left of the particle, in the areas where a rounded edge is initially observed to occur in the ADF images in Figures 1 and 2, compared to the bottom right, where the facet is still observed in the ADF images. As the facet disappears, the split decreases at the bottom right and increases at the top and left of the particle. The final state again shows the largest split occurring in the middle of the particle, and the eg-t2g split for both the L3 and L2 peaks decreases towards the edges. This suggests that the transition from CaCO3 to an intermediate disordered phase to CaO occurs heterogeneously across the particle. This local variation in fine structure could not have been observed just by analyzing the average change in ELNES of the Ca L2,3 edge in Figure 4b.
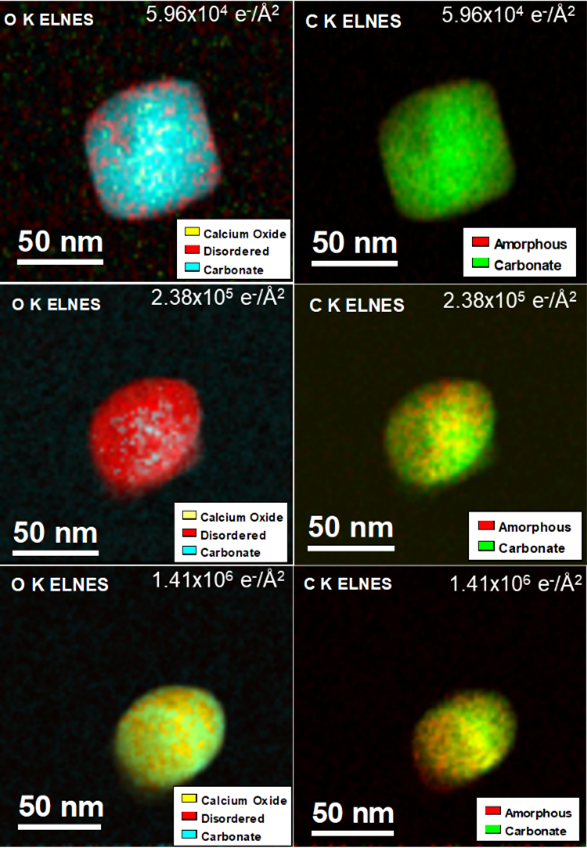
Figure 6. Phase maps generated by MLLS fitting of the O K (left column) and C K (right column) edges. The ELNES plotted in Figure 4 were used as internal references.
The multiple linear least squares (MLLS) standards-based quantification tool in DigitalMicrograph was used to generate the phase maps of C and O shown in Figure 6. Plural scattering correction was enabled to account for variations in the thickness of the particles. The ELNES plotted in Figure 4 were used as internal standards for the C K and O K ELNES. In the first column of Figure 6, the O K ELNES shows a transition from the carbonate phase to the calcium oxide phase with increasing fluence. In the initial state, the disordered phase is observed around the edges of the particle and where the large void begins to occur at higher total fluences. In the transition state, the particle appears mainly in the disordered phase, with some calcium oxide appearing. In the final observed state, the calcium oxide phase is primarily observed.
The second column in Figure 6 shows a more subtle transition in the C K-edge ELNES. In the initial state, only the carbonate phase is present. As the fluence increases, more of the amorphous phase is observed. However, the carbonate phase never completely disappears. A strong weighted fit to ELNES from the carbonate phase is likely due to the presence of the strong π̽ and σ̽ peaks observed in the ELNES extracted from the final state of the particle in Figure 4c and suggests that the CO32- anions are still present in the particle. However, it is not clear as to how they are incorporated with the new CaO phase.
Conclusion
In-situ multi-pass spectrum imaging, combined with the added sensitivity of the K3, allowed us to characterize changes to the CaCO3 particles during radiolysis with a spatial sensitivity not achieved by previous studies. The projected area and thickness decreased with increasing fluence, showing a loss in mass with radiolysis. Changes in morphology and decreases in the concentration (areal density) of C, Ca, and O in the CaCO3 particles were observed with increasing fluence. The most significant change in composition occurred from the loss of C and O, which likely converted to CO2 and sublimated in vacuum. The high sensitivity of the K3 detector allows us to confirm the phase transition from CaCO3 to CaO through ELNES analysis of the C K, Ca L2,3, and O K edges. Due to the higher spatial sampling, the reduction of CaCO3 was observed to occur anisotropically rather than isotropically from the edges into the center of the particle. An intermediate, disordered phase, consistent with previous studies, was observed by analyzing the split in the Ca L2,3 edge [5]. A CO32- anion was observed to still be present in the particle, even after CaO had formed. This differs from previous studies, which suggested that C would have been completely converted to CO2 once CaO was formed [5]. It was previously shown through brightfield TEM and STEM that the reduced CaCO3 particles developed a porous structure. Based on these previous results and what was observed in this study, it is likely that the final state of the particle is a porous network of CaO crystallites intermixed with a remnant carbonate phase.
References
[1] J. Hart et. al., Sci Rep. 7 (2017) 8243 doi : 10.1038/s41598-017-07709-4.
[2] R. Hooley, A. Brown, R. Brydson Micron 120 (2019) p25-34 doi: 10.1016/j.micron.2019.01.011.
[3] AWD Hills, Chemical Engineering Sciences 23 (1968) pg297-320 doi: 10.1016/0009-2509(68)87002-2.
[4] R. F. Egerton et. al., Ultramicroscopy 110 (2010) 991-997 doi : 10.1016/j.ultramic.2009.11.003
[5] U. Golla-Schindler, G. Benner, A. Orchowski, U. Kaiser, Microsc. Microanal. 20 (2014) pg715-722 doi: 10.1017/S1431927614000464.
[6] L. A .J. Garvie, A.J. Craven, and R. Brydson, R. Am Mineralogist (1994) 79, pg411–425.
[7] P. Rez, A. Blackwell, J. Phys. Chem. B 115 (2011) 11193-11198.
[8] F. Hofer, P. Golob, Ultramicroscopy 21 (1987) p379-383 doi: 10.1016/0304-3991(87)90036-2
[9] F. M. F. de Groot et. Al. Phys. Rev. B. 40 (1989) 5715 doi: 10.1103/PhysRevB.40.5715.